Oracle 2008 Annual Report Download - page 59
Download and view the complete annual report
Please find page 59 of the 2008 Oracle annual report below. You can navigate through the pages in the report by either clicking on the pages listed below, or by using the keyword search tool below to find specific information within the annual report.-
 1
1 -
2
-
3
-
4
-
5
-
6
-
7
-
8
-
9
-
10
-
11
-
12
-
13
-
14
-
15
-
16
-
17
-
18
-
19
-
20
-
21
-
22
-
23
-
24
-
25
-
26
-
27
-
28
-
29
-
30
-
31
-
32
-
33
-
34
-
35
-
36
-
37
-
38
-
39
-
40
-
41
-
42
-
43
-
44
-
45
-
46
-
47
-
48
-
 49
49 -
 50
50 -
 51
51 -
 52
52 -
 53
53 -
 54
54 -
 55
55 -
 56
56 -
 57
57 -
 58
58 -
 59
59 -
 60
60 -
 61
61 -
 62
62 -
 63
63 -
 64
64 -
 65
65 -
 66
66 -
 67
67 -
 68
68 -
 69
69 -
70
-
71
-
72
-
73
-
74
-
75
-
76
-
77
-
78
-
79
-
80
-
81
-
82
-
83
-
84
-
85
-
86
-
87
-
88
-
89
-
90
-
91
-
92
-
93
-
94
-
95
-
96
-
97
-
98
-
99
-
100
-
101
-
102
-
103
-
104
-
105
-
106
-
107
-
108
-
109
-
110
-
111
-
112
-
113
-
114
-
115
-
116
-
117
-
118
-
119
-
120
-
121
-
122
-
123
-
124
-
125
-
126
-
127
-
128
-
129
-
130
-
131
-
132
-
133
-
134
-
135
-
136
-
137
-
138
-
139
-
140
-
141
-
142
-
143
-
144
-
145
-
146
-
147
-
148
-
149
-
150
 |
 |

Table of Contents
senior notes outstanding for the majority of fiscal 2008 and our issuances of short-term commercial paper in
the fourth quarter of fiscal 2008 and fourth quarter of fiscal 2007 (we repaid these commercial paper amounts
during fiscal 2008).
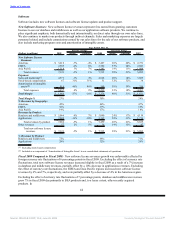
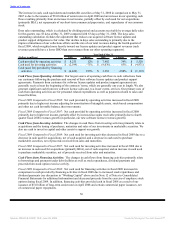
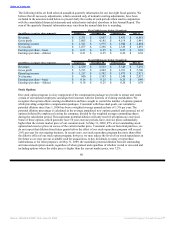
Non-Operating Income, net: Non-operating income, net consists primarily of interest income, net foreign
currency exchange gains and losses, the minority owners’ share in the net profits of our majority-owned
Oracle Financial Services Software Limited (formerly i-flex solutions limited) and Oracle Japan subsidiaries,
and other income, net, including net realized gains and losses related to all of our investments and net
unrealized gains and losses related to the small portion of our investment portfolio that we classify as trading.
Year Ended May 31,
Percent Change Percent Change
(Dollars in millions) 2009 Actual Constant 2008 Actual Constant 2007
Interest income $ 279 -17% -11% $ 337 14% 9% $ 295
Foreign currency
(losses) gains, net (55) -236% -203% 40 -10% 3% 45
Minority interests in
income (84) -41% -48% (60) -15% -18% (71)
Other income, net 3 -95% -96% 67 -22% -26% 86
Total
non-operating
income, net $ 143 -63% -54% $ 384 8% 5% $ 355
Fiscal 2009 Compared to Fiscal 2008: Non-operating income, net decreased during fiscal 2009 as a result of
a reduction in our interest income, primarily due to lower market rates that affected the yields earned on our
investment portfolio and net foreign currency transaction losses of $55 million in comparison to net foreign
currency transaction gains of $40 million in the corresponding prior year. Non-operating income, net was also
affected by changes in our investments that we classify as trading that support our deferred compensation plan
obligations. The majority of these changes decreased “Other income, net” in the table above during the
second quarter of fiscal 2009. We account for our deferred compensation plan assets and obligations pursuant
to EITF 97-14, Accounting for Deferred Compensation Arrangements Where Amounts Earned Are Held in a
Rabbi Trust and Invested, which requires that the changes in obligations associated with our deferred
compensation plan be recorded in our operating expenses while the corresponding change in the plan assets
be recorded in non-operating income, net. The changes in obligations and asset values of the plan are equal
and offsetting, such that there is no impact to our income before provision for income taxes during fiscal 2009
or any other periods presented.
Fiscal 2008 Compared to Fiscal 2007: Non-operating income, net increased in fiscal 2008 primarily due to
an increase in interest income from higher weighted average cash and marketable securities balances during
fiscal 2008.
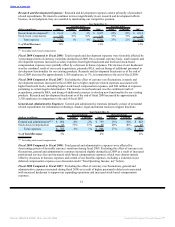
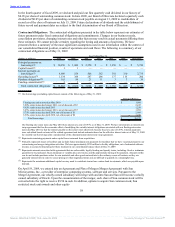
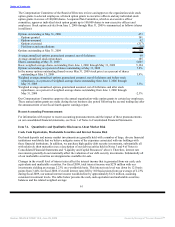
Provision for Income Taxes: The effective tax rate in all periods is the result of the mix of income earned in
various tax jurisdictions that apply a broad range of income tax rates. The provision for income taxes differs
from the tax computed at the U.S. federal statutory income tax rate due primarily to state taxes and earnings
considered as indefinitely reinvested in foreign operations. Future effective tax rates could be adversely
affected if earnings are lower than anticipated in countries where we have lower statutory rates, by
unfavorable changes in tax laws and regulations or by adverse rulings in tax related litigation.
Year Ended May 31,
Percent Change Percent Change
(Dollars in millions) 2009 Actual Constant 2008 Actual Constant 2007
Provision for income
taxes $ 2,241 -3% 6% $ 2,313 35% 32% $ 1,712
Effective tax rate 28.6% 29.5% 28.6%
Fiscal 2009 Compared to Fiscal 2008: Provision for income taxes decreased during fiscal 2009 in
comparison to fiscal 2008 due to a lower effective tax rate, which was primarily the result of a higher
proportion of our worldwide taxable income being earned in lower tax rate jurisdictions.
In fiscal 2010, we will adopt Statement 141(R), which amends FASB Statement No. 109, Accounting for
Income Taxes and FIN 48. For fiscal 2009 and prior periods, we generally accounted for post-acquisition
adjustments to business combination related deferred tax asset valuation allowances and liabilities related to
uncertain tax
54
Source: ORACLE CORP, 10-K, June 29, 2009 Powered by Morningstar® Document Research℠