Oracle 2008 Annual Report Download - page 46
Download and view the complete annual report
Please find page 46 of the 2008 Oracle annual report below. You can navigate through the pages in the report by either clicking on the pages listed below, or by using the keyword search tool below to find specific information within the annual report.-
 1
1 -
2
-
3
-
4
-
5
-
6
-
7
-
8
-
9
-
10
-
11
-
12
-
13
-
14
-
15
-
16
-
17
-
18
-
19
-
20
-
21
-
22
-
23
-
24
-
25
-
26
-
27
-
28
-
29
-
30
-
31
-
32
-
33
-
34
-
35
-
 36
36 -
 37
37 -
 38
38 -
 39
39 -
 40
40 -
 41
41 -
 42
42 -
 43
43 -
 44
44 -
 45
45 -
 46
46 -
 47
47 -
 48
48 -
 49
49 -
 50
50 -
 51
51 -
 52
52 -
 53
53 -
 54
54 -
 55
55 -
 56
56 -
57
-
58
-
59
-
60
-
61
-
62
-
63
-
64
-
65
-
66
-
67
-
68
-
69
-
70
-
71
-
72
-
73
-
74
-
75
-
76
-
77
-
78
-
79
-
80
-
81
-
82
-
83
-
84
-
85
-
86
-
87
-
88
-
89
-
90
-
91
-
92
-
93
-
94
-
95
-
96
-
97
-
98
-
99
-
100
-
101
-
102
-
103
-
104
-
105
-
106
-
107
-
108
-
109
-
110
-
111
-
112
-
113
-
114
-
115
-
116
-
117
-
118
-
119
-
120
-
121
-
122
-
123
-
124
-
125
-
126
-
127
-
128
-
129
-
130
-
131
-
132
-
133
-
134
-
135
-
136
-
137
-
138
-
139
-
140
-
141
-
142
-
143
-
144
-
145
-
146
-
147
-
148
-
149
-
150
 |
 |

Table of Contents
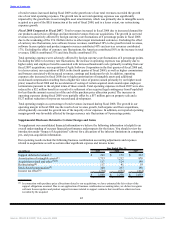
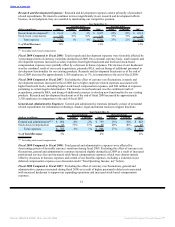
Total Revenues and Operating Expenses
Year Ended May 31,
Percent Change Percent Change
(Dollars in millions) 2009 Actual Constant 2008 Actual Constant 2007
Total Revenues by
Geography:
Americas $ 11,900 5% 8% $ 11,330 20% 18% $ 9,460
EMEA(1) 7,948 0% 11% 7,945 32% 20% 6,037
Asia Pacific(2) 3,404 8% 13% 3,155 26% 18% 2,499
Total revenues 23,252 4% 10% 22,430 25% 19% 17,996
Total Operating
Expenses 14,931 2% 7% 14,586 21% 17% 12,022
Total Operating
Margin $ 8,321 6% 15% $ 7,844 31% 22% $ 5,974
Total Operating
Margin % 36% 35% 33%
% Revenues by
Geography:
Americas 51% 51% 53%
EMEA(1) 34% 35% 34%
Asia Pacific 15% 14% 13%
Total Revenues by
Business:
Software $ 18,877 6% 12% $ 17,843 26% 19% $ 14,211
Services 4,375 -5% 1% 4,587 21% 15% 3,785
Total revenues $ 23,252 4% 10% $ 22,430 25% 19% $ 17,996
% Revenues by
Business:
Software 81% 80% 79%
Services 19% 20% 21%
(1) Comprised of Europe, the Middle East and Africa
(2) Asia Pacific includes Japan
Fiscal 2009 Compared to Fiscal 2008: Our operating results for fiscal 2009 were significantly impacted by
the strengthening of the U.S. Dollar relative to other major international currencies. These currency variances
resulted in a reduction to our total revenues growth of 6 percentage points during fiscal 2009. On a constant
currency basis, total revenues increased in fiscal 2009 primarily due to higher software license update and
product support revenues in all regions due to the high attachment rate of support contracts to our new
software license sales and the renewal of substantially all of our eligible customer support contracts,
incremental revenues from our recent acquisitions, primarily our acquisition of BEA in the fourth quarter of
fiscal 2008, and increased demand for our On Demand service offerings. On a constant currency basis, new
software license revenues contributed 5% to the growth in total revenues, software license updates and
product support revenues contributed 92% and services revenues contributed 3%. Excluding the effect of
currency rate fluctuations, the Americas contributed 39% to the increase in total revenues, EMEA contributed
42% and Asia Pacific contributed 19%.
Currency variances resulted in a reduction to our total operating expense growth of 5 percentage points during
fiscal 2009. Excluding the effect of currency rate fluctuations, the increase in operating expenses in fiscal
2009 is primarily due to higher salary expenses associated with increased headcount levels from acquisitions
(primarily BEA) and higher amortization of intangible assets resulting from our acquisitions (primarily BEA)
that we completed since the beginning of fiscal 2008. In addition, acquisition related and other expenses
increased during fiscal 2009 due to a $57 million gain on property sale recognized in fiscal 2008, which
decreased operating expenses in that period. These increases were partially offset by constant currency
decreases in our commissions and bonus expenses.
Currency variances resulted in a reduction of 9 percentage points to our total operating margin growth during
fiscal 2009. On a constant and reported currency basis, total operating margin and total operating margin as a
percentage
41
Source: ORACLE CORP, 10-K, June 29, 2009 Powered by Morningstar® Document Research℠