Oracle 2008 Annual Report Download - page 52
Download and view the complete annual report
Please find page 52 of the 2008 Oracle annual report below. You can navigate through the pages in the report by either clicking on the pages listed below, or by using the keyword search tool below to find specific information within the annual report.-
 1
1 -
2
-
3
-
4
-
5
-
6
-
7
-
8
-
9
-
10
-
11
-
12
-
13
-
14
-
15
-
16
-
17
-
18
-
19
-
20
-
21
-
22
-
23
-
24
-
25
-
26
-
27
-
28
-
29
-
30
-
31
-
32
-
33
-
34
-
35
-
36
-
37
-
38
-
39
-
40
-
41
-
 42
42 -
 43
43 -
 44
44 -
 45
45 -
 46
46 -
 47
47 -
 48
48 -
 49
49 -
 50
50 -
 51
51 -
 52
52 -
 53
53 -
 54
54 -
 55
55 -
 56
56 -
 57
57 -
 58
58 -
 59
59 -
 60
60 -
 61
61 -
 62
62 -
63
-
64
-
65
-
66
-
67
-
68
-
69
-
70
-
71
-
72
-
73
-
74
-
75
-
76
-
77
-
78
-
79
-
80
-
81
-
82
-
83
-
84
-
85
-
86
-
87
-
88
-
89
-
90
-
91
-
92
-
93
-
94
-
95
-
96
-
97
-
98
-
99
-
100
-
101
-
102
-
103
-
104
-
105
-
106
-
107
-
108
-
109
-
110
-
111
-
112
-
113
-
114
-
115
-
116
-
117
-
118
-
119
-
120
-
121
-
122
-
123
-
124
-
125
-
126
-
127
-
128
-
129
-
130
-
131
-
132
-
133
-
134
-
135
-
136
-
137
-
138
-
139
-
140
-
141
-
142
-
143
-
144
-
145
-
146
-
147
-
148
-
149
-
150
 |
 |

Table of Contents
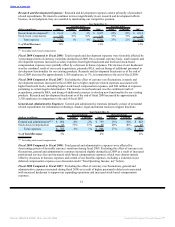
Total software license updates and product support margin increased due to an increase in revenues, while
margin as a percentage of revenues decreased slightly as the growth in our amortization of intangible assets
exceeded our revenues growth.
Fiscal 2008 Compared to Fiscal 2007: The growth in our software license updates and product support
revenues was favorably affected by foreign currency rate fluctuations of 6 percentage points in fiscal 2008.
Excluding the effect of currency rate fluctuations, software license updates and product support revenues
increased in fiscal 2008 in comparison to fiscal 2007 for similar reasons as those noted above. Excluding the
effect of currency rate fluctuations, the Americas contributed 53%, EMEA contributed 36% and Asia Pacific
contributed 11% to the increase in software license updates and product support revenues. Software license
updates and product support revenues in fiscal 2008 included incremental revenues of $303 million from
Hyperion, $38 million from BEA, $38 million from Agile, $30 million from Stellent, $25 million from
Metasolv, and $46 million from other recently acquired companies.
Software license updates and product support expenses were adversely impacted by 3 percentage points of
unfavorable currency variations during fiscal 2008. Excluding the effect of currency rate fluctuations,
software license updates and product support expenses increased due to higher salary and benefits associated
with increased headcount to support the expansion of our customer base, higher bonuses and commissions,
and higher amortization expenses resulting from additional intangible assets acquired since the beginning of
fiscal 2007. Total software license updates and product support margin and margin as a percentage of
revenues increased as our revenues grew faster than expenses, but was partially offset by a higher growth rate
in our amortization of intangible assets.
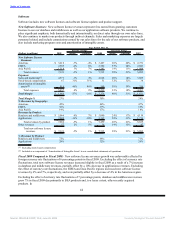
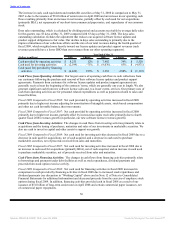
Services
Services consist of consulting, On Demand and education.
Consulting: Consulting revenues are earned by providing services to customers in the design,
implementation, deployment and upgrade of our database and middleware software products as well as
applications software products. The cost of providing consulting services consists primarily of personnel
related expenditures.
Year Ended May 31,
Percent Change Percent Change
(Dollars in millions) 2009 Actual Constant 2008 Actual Constant 2007
Consulting Revenues:
Americas $ 1,639 -5% -2% $ 1,720 12% 10% $ 1,534
EMEA 1,152 -11% -1% 1,291 25% 14% 1,033
Asia Pacific 456 -2% 5% 466 54% 42% 302
Total revenues 3,247 -7% -1% 3,477 21% 15% 2,869
Expenses:
Cost of services(1) 2,781 -8% -2% 3,014 22% 16% 2,477
Stock-based compensation 6 -12% -12% 7 -18% -18% 9
Amortization of intangible
assets(2) 40 -4% -3% 42 38% 38% 30
Total expenses 2,827 -8% -2% 3,063 22% 16% 2,516
Total Margin $ 420 1% 11% $ 414 17% 10% $ 353
Total Margin % 13% 12% 12%
% Revenues by Geography:
Americas 51% 50% 53%
EMEA 35% 37% 36%
Asia Pacific 14% 13% 11%
(1) Excluding stock-based compensation
(2) Included as a component of ‘Amortization of Intangible Assets’ in our consolidated statements of operations
Fiscal 2009 Compared to Fiscal 2008: Consulting revenues were unfavorably affected by foreign currency
rate fluctuations of 6 percentage points in fiscal 2009. Excluding the effect of currency rate fluctuations, we
believe the
47
Source: ORACLE CORP, 10-K, June 29, 2009 Powered by Morningstar® Document Research℠