Oracle 2008 Annual Report Download - page 122
Download and view the complete annual report
Please find page 122 of the 2008 Oracle annual report below. You can navigate through the pages in the report by either clicking on the pages listed below, or by using the keyword search tool below to find specific information within the annual report.-
 1
1 -
2
-
3
-
4
-
5
-
6
-
7
-
8
-
9
-
10
-
11
-
12
-
13
-
14
-
15
-
16
-
17
-
18
-
19
-
20
-
21
-
22
-
23
-
24
-
25
-
26
-
27
-
28
-
29
-
30
-
31
-
32
-
33
-
34
-
35
-
36
-
37
-
38
-
39
-
40
-
41
-
42
-
43
-
44
-
45
-
46
-
47
-
48
-
49
-
50
-
51
-
52
-
53
-
54
-
55
-
56
-
57
-
58
-
59
-
60
-
61
-
62
-
63
-
64
-
65
-
66
-
67
-
68
-
69
-
70
-
71
-
72
-
73
-
74
-
75
-
76
-
77
-
78
-
79
-
80
-
81
-
82
-
83
-
84
-
85
-
86
-
87
-
88
-
89
-
90
-
91
-
92
-
93
-
94
-
95
-
96
-
97
-
98
-
99
-
100
-
101
-
102
-
103
-
104
-
105
-
106
-
107
-
108
-
109
-
110
-
111
-
 112
112 -
 113
113 -
 114
114 -
 115
115 -
 116
116 -
 117
117 -
 118
118 -
 119
119 -
 120
120 -
 121
121 -
 122
122 -
 123
123 -
 124
124 -
 125
125 -
 126
126 -
 127
127 -
 128
128 -
 129
129 -
 130
130 -
 131
131 -
 132
132 -
133
-
134
-
135
-
136
-
137
-
138
-
139
-
140
-
141
-
142
-
143
-
144
-
145
-
146
-
147
-
148
-
149
-
150
 |
 |

Table of Contents
ORACLE CORPORATION
NOTES TO CONSOLIDATED FINANCIAL STATEMENTS—(Continued)
May 31, 2009
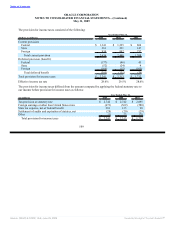
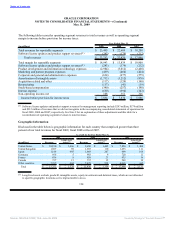
The following table reconciles operating segment revenues to total revenues as well as operating segment
margin to income before provision for income taxes:
Year Ended May 31,
(in millions) 2009 2008 2007
Total revenues for reportable segments $ 23,495 $ 22,609 $ 18,208
Software license updates and product support revenues(1) (243) (179) (212)
Total revenues $ 23,252 $ 22,430 $ 17,996
Total margin for reportable segments $ 14,943 $ 13,839 $ 10,909
Software license updates and product support revenues(1) (243) (179) (212)
Product development and information technology expenses (2,984) (3,012) (2,460)
Marketing and partner program expenses (439) (460) (424)
Corporate and general and administrative expenses (634) (677) (575)
Amortization of intangible assets (1,713) (1,212) (878)
Acquisition related and other (117) (124) (140)
Restructuring (117) (41) (19)
Stock-based compensation (340) (257) (198)
Interest expense (630) (394) (343)
Non-operating income, net 108 351 326
Income before provision for income taxes $ 7,834 $ 7,834 $ 5,986
(1) Software license updates and product support revenues for management reporting include $243 million, $179 million
and $212 million of revenues that we did not recognize in the accompanying consolidated statements of operations for
fiscal 2009, 2008 and 2007, respectively. See Note 9 for an explanation of these adjustments and this table for a
reconciliation of operating segment revenues to total revenues.
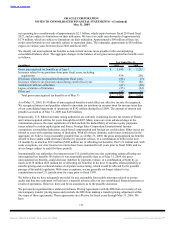
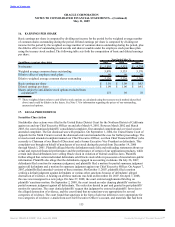
Geographic Information
Disclosed in the table below is geographic information for each country that comprised greater than three
percent of our total revenues for fiscal 2009, fiscal 2008 or fiscal 2007.
As of and for the Year Ended May 31,
2009 2008 2007
Long Lived Long Lived Long Lived
(in millions) Revenues Assets(1) Revenues Assets(1) Revenues Assets(1)
United States $ 10,190 $ 1,466 $ 9,650 $ 1,465 $ 7,826 $ 1,404
United Kingdom 1,587 89 1,655 110 1,293 111
Japan 1,189 485 1,068 207 909 164
Germany 956 5 983 9 720 11
France 856 8 858 21 635 16
Canada 737 13 737 15 548 10
Other countries 7,737 462 7,479 532 6,065 415
Total $ 23,252 $ 2,528 $ 22,430 $ 2,359 $ 17,996 $ 2,131
(1) Long-lived assets exclude goodwill, intangible assets, equity investments and deferred taxes, which are not allocated
to specific geographic locations as it is impracticable to do so.
114
Source: ORACLE CORP, 10-K, June 29, 2009 Powered by Morningstar® Document Research℠