Oracle 2008 Annual Report Download - page 55
Download and view the complete annual report
Please find page 55 of the 2008 Oracle annual report below. You can navigate through the pages in the report by either clicking on the pages listed below, or by using the keyword search tool below to find specific information within the annual report.-
 1
1 -
2
-
3
-
4
-
5
-
6
-
7
-
8
-
9
-
10
-
11
-
12
-
13
-
14
-
15
-
16
-
17
-
18
-
19
-
20
-
21
-
22
-
23
-
24
-
25
-
26
-
27
-
28
-
29
-
30
-
31
-
32
-
33
-
34
-
35
-
36
-
37
-
38
-
39
-
40
-
41
-
42
-
43
-
44
-
 45
45 -
 46
46 -
 47
47 -
 48
48 -
 49
49 -
 50
50 -
 51
51 -
 52
52 -
 53
53 -
 54
54 -
 55
55 -
 56
56 -
 57
57 -
 58
58 -
 59
59 -
 60
60 -
 61
61 -
 62
62 -
 63
63 -
 64
64 -
 65
65 -
66
-
67
-
68
-
69
-
70
-
71
-
72
-
73
-
74
-
75
-
76
-
77
-
78
-
79
-
80
-
81
-
82
-
83
-
84
-
85
-
86
-
87
-
88
-
89
-
90
-
91
-
92
-
93
-
94
-
95
-
96
-
97
-
98
-
99
-
100
-
101
-
102
-
103
-
104
-
105
-
106
-
107
-
108
-
109
-
110
-
111
-
112
-
113
-
114
-
115
-
116
-
117
-
118
-
119
-
120
-
121
-
122
-
123
-
124
-
125
-
126
-
127
-
128
-
129
-
130
-
131
-
132
-
133
-
134
-
135
-
136
-
137
-
138
-
139
-
140
-
141
-
142
-
143
-
144
-
145
-
146
-
147
-
148
-
149
-
150
 |
 |

Table of Contents
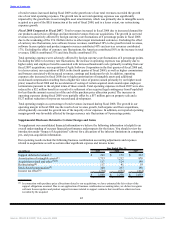
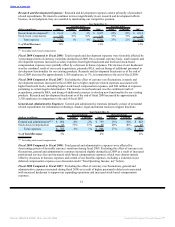
Total On Demand margin as a percentage of revenues improved primarily as a result of our Oracle On
Demand business, which increased revenues while managing operating expenses to a level consistent with
fiscal 2007. Our Advanced Customer Services margin and margin percentages also improved in comparison
to fiscal 2007.
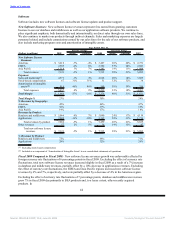
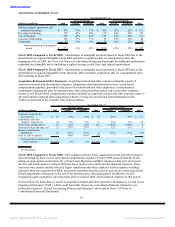
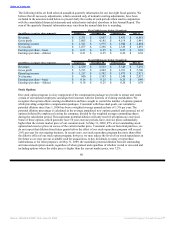
Education: Education revenues are earned by providing instructor-led, media-based and internet-based
training in the use of our database and middleware software products as well as applications software
products. Education expenses primarily consist of personnel related expenditures, facilities and external
contractor costs.
Year Ended May 31,
Percent Change Percent Change
(Dollars in millions) 2009 Actual Constant 2008 Actual Constant 2007
Education Revenues:
Americas $ 151 -17% -15% $ 181 10% 8% $ 164
EMEA 127 -20% -13% 159 20% 9% 132
Asia Pacific 71 -7% -3% 76 22% 14% 63
Total revenues 349 -16% -12% 416 16% 10% 359
Expenses:
Cost of services(1) 292 -10% -5% 325 15% 8% 283
Stock-based compensation 2 19% 19% 1 -17% -17% 2
Total expenses 294 -10% -5% 326 15% 8% 285
Total Margin $ 55 -39% -38% $ 90 21% 16% $ 74
Total Margin % 16% 22% 21%
% Revenues by Geography:
Americas 43% 44% 46%
EMEA 37% 38% 37%
Asia Pacific 20% 18% 17%
(1) Excluding stock-based compensation
Fiscal 2009 Compared to Fiscal 2008: Excluding the effect of unfavorable currency rate fluctuations of
4 percentage points, education revenues decreased in fiscal 2009 as we experienced weaker demand for our
educational services that we believe was the result of weaker global economic conditions.
Excluding the effect of favorable currency rate fluctuations of 5 percentage points, education expenses
declined in comparison to fiscal 2008, due to headcount reductions associated with restructuring actions taken
and a reduction in other variable costs associated with the decline in business activity.
Education margin and margin as a percentage of revenues decreased in fiscal 2009 due to a reduction in our
revenues, which declined at a higher rate than our expense reductions.
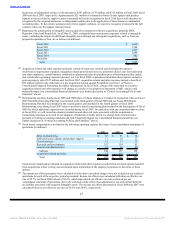
Fiscal 2008 Compared to Fiscal 2007: Education revenues growth was positively affected by foreign
currency rate fluctuations of 6 percentage points in fiscal 2008. Excluding the effect of currency rate
fluctuations, education revenues increased in fiscal 2008 due primarily to an increase in customer training on
the use of our applications products, including our acquired products. Excluding the effect of currency rate
fluctuations, the Americas contributed 39%, EMEA contributed 36% and Asia Pacific contributed 25% to the
increase in education revenues.
Excluding the effect of unfavorable currency rate fluctuations of 7 percentage points, education expenses
increased due to higher personnel related expenses during the first half of fiscal 2008 and were partially offset
by lower personnel related expenses in the second half of fiscal 2008 as a result of restructuring actions taken.
Education margin and margin as a percentage of revenues increased slightly in fiscal 2008 as revenue growth
exceeded expense growth.
50
Source: ORACLE CORP, 10-K, June 29, 2009 Powered by Morningstar® Document Research℠