Oracle 2008 Annual Report Download - page 54
Download and view the complete annual report
Please find page 54 of the 2008 Oracle annual report below. You can navigate through the pages in the report by either clicking on the pages listed below, or by using the keyword search tool below to find specific information within the annual report.-
 1
1 -
2
-
3
-
4
-
5
-
6
-
7
-
8
-
9
-
10
-
11
-
12
-
13
-
14
-
15
-
16
-
17
-
18
-
19
-
20
-
21
-
22
-
23
-
24
-
25
-
26
-
27
-
28
-
29
-
30
-
31
-
32
-
33
-
34
-
35
-
36
-
37
-
38
-
39
-
40
-
41
-
42
-
43
-
 44
44 -
 45
45 -
 46
46 -
 47
47 -
 48
48 -
 49
49 -
 50
50 -
 51
51 -
 52
52 -
 53
53 -
 54
54 -
 55
55 -
 56
56 -
 57
57 -
 58
58 -
 59
59 -
 60
60 -
 61
61 -
 62
62 -
 63
63 -
 64
64 -
65
-
66
-
67
-
68
-
69
-
70
-
71
-
72
-
73
-
74
-
75
-
76
-
77
-
78
-
79
-
80
-
81
-
82
-
83
-
84
-
85
-
86
-
87
-
88
-
89
-
90
-
91
-
92
-
93
-
94
-
95
-
96
-
97
-
98
-
99
-
100
-
101
-
102
-
103
-
104
-
105
-
106
-
107
-
108
-
109
-
110
-
111
-
112
-
113
-
114
-
115
-
116
-
117
-
118
-
119
-
120
-
121
-
122
-
123
-
124
-
125
-
126
-
127
-
128
-
129
-
130
-
131
-
132
-
133
-
134
-
135
-
136
-
137
-
138
-
139
-
140
-
141
-
142
-
143
-
144
-
145
-
146
-
147
-
148
-
149
-
150
 |
 |

Table of Contents
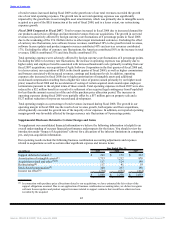
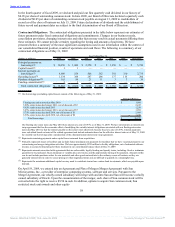
Year Ended May 31,
Percent Change Percent Change
(Dollars in millions) 2009 Actual Constant 2008 Actual Constant 2007
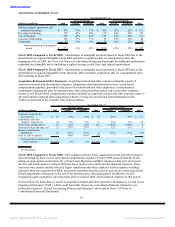
On Demand Revenues:
Americas $ 432 15% 18% $ 375 20% 18% $ 313
EMEA 230 2% 13% 226 29% 18% 176
Asia Pacific 117 26% 33% 93 36% 28% 68
Total revenues 779 12% 18% 694 25% 19% 557
Expenses:
Cost of services(1) 621 -2% 4% 632 10% 6% 574
Stock-based compensation 4 -9% -9% 5 16% 16% 4
Amortization of intangible
assets(2) 13 -1% -1% 14 0% 0% 14
Total expenses 638 -2% 3% 651 10% 6% 592
Total Margin $ 141 228% 225% $ 43 224% 213% $ (35)
Total Margin % 18% 6% -6%
% Revenues by Geography:
Americas 55% 54% 56%
EMEA 30% 33% 32%
Asia Pacific 15% 13% 12%
(1) Excluding stock-based compensation
(2) Included as a component of ‘Amortization of Intangible Assets’ in our consolidated statements of operations
Fiscal 2009 Compared to Fiscal 2008: On Demand revenue growth was unfavorably affected by foreign
currency rate fluctuations of 6 percentage points in fiscal 2009. On Demand revenues increased in fiscal 2009
due to an increase in each service category’s subscription base as a greater number of customers engaged us
to provide IT services and outsourcing solutions. On a constant currency basis, Advanced Customer Services
contributed the majority of our On Demand revenues growth. Excluding the effect of currency rate
fluctuations, the Americas contributed 52%, EMEA contributed 23% and Asia Pacific contributed 25% to the
increase in On Demand revenues.
Excluding the effect of favorable currency rate fluctuations of 5 percentage points, On Demand expenses
increased modestly in fiscal 2009 due to higher personnel related costs resulting from additional employees
hired to support the increase in On Demand revenues. This expense increase was partially offset by a shift of
certain U.S. based costs to global support centers in lower cost countries.
Total On Demand margin and margin as a percentage of revenues improved primarily as a result of our
Oracle On Demand business, which increased revenues while managing operating expenses to a modest level
of growth in comparison to fiscal 2008. Our Advanced Customer Services margin and margin percentages
also improved in comparison to fiscal 2008.
Fiscal 2008 Compared to Fiscal 2007: On Demand revenue growth was positively affected by foreign
currency rate fluctuations of 6 percentage points in fiscal 2008. Excluding the effect of currency rate
fluctuations, On Demand revenues increased in fiscal 2008 due to similar reasons as noted above. On a
constant currency basis, Oracle On Demand and Advanced Customer Services contributed approximately
equal amounts to the growth in On Demand revenues. Excluding the effect of currency rate fluctuations, the
Americas contributed 53%, EMEA contributed 29% and Asia Pacific contributed 18% to the increase in On
Demand revenues.
Excluding the effect of unfavorable currency rate fluctuations of 4 percentage points, On Demand expenses
increased in fiscal 2008 due to higher salaries and benefits expenses associated with increased headcount, and
higher technology infrastructure related expenses to support the expansion of our customer base. These
expense increases were partially offset by a shift of certain U.S. based costs to global support centers in lower
cost countries.
49
Source: ORACLE CORP, 10-K, June 29, 2009 Powered by Morningstar® Document Research℠