Nordstrom 2011 Annual Report Download - page 63
Download and view the complete annual report
Please find page 63 of the 2011 Nordstrom annual report below. You can navigate through the pages in the report by either clicking on the pages listed below, or by using the keyword search tool below to find specific information within the annual report.
Nordstrom, Inc. and subsidiaries 63
Nordstrom, Inc.
Notes to Consolidated Financial Statements
Dollar and share amounts in millions except per share, per option and unit amounts
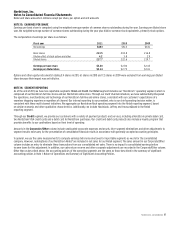
The following table summarizes net sales within our reportable segments:
Fiscal year 2011 2010 2009
Nordstrom $8,426 $7,700 $6,923
Nordstrom Rack 2,045 1,691 1,411
Other retail1 185 29 29
Total Retail segment 10,656 9,420 8,363
Corporate/Other (159) (110) (105)
Total net sales $10,497 $9,310 $8,258
1Other retail includes our HauteLook online private sale subsidiary, our Jeffrey stores and our treasure&bond store.
The following table summarizes net sales by merchandise category:
Fiscal year 2011 2010 2009
Net sales % of total Net sales % of total Net sales % of total
Women’s apparel $3,438 33% $3,184 34% $2,845 34%
Shoes 2,413 23% 2,094 23% 1,787 22%
Men’s apparel 1,612 15% 1,415 15% 1,262 15%
Women’s accessories 1,311 12% 1,101 12% 970 12%
Cosmetics 1,106 11% 972 10% 895 11%
Children’s apparel 341 3% 303 3% 283 3%
Other 276 3% 241 3% 216 3%
Total net sales $10,497 100% $9,310 100% $8,258 100%
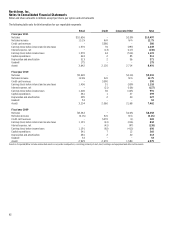
NOTE 17: SELECTED QUARTERLY DATA (UNAUDITED)
1st Quarter 2nd Quarter 3rd Quarter 4th Quarter Total
Fiscal year 2011
Net sales
$2,229
$2,716
$2,383
$3,169
$10,497
Same–store sales percentage change1 6.5% 7.3% 7.9% 7.1% 7.2%
Credit card revenues 94 94 95 97 380
Gross profit2 844 993 872 1,196 3,905
Selling, general and administrative expenses:
Retail 611 708 670 818 2,807
Credit 55 59 57 58 229
Earnings before income taxes 241 290 209 379 1,119
Net earnings 145 175 127 236 683
Earnings per basic share $0.66 $0.81 $0.60 $1.13 $3.20
Earnings per diluted share $0.65 $0.80 $0.59 $1.11 $3.14
Fiscal year 2010
Net sales $1,990 $2,417 $2,087 $2,816 $9,310
Same-store sales percentage change1 12.0% 8.4% 5.8% 6.7%
8.1%
Credit card revenues 97 98 95 100 390
Gross profit2 747 852 756 1,058 3,413
Selling, general and administrative expenses:
Retail 533 613 569 697 2,412
Credit 92 65 61 55 273
Earnings before income taxes 188 240 190 373 991
Net earnings 116 146 119 232 613
Earnings per basic share $0.53 $0.67 $0.54 $1.06 $2.80
Earnings per diluted share $0.52 $0.66 $0.53 $1.04 $2.75
1Same-store sales include sales from stores that have been open at least one full year at the beginning of the year. We also include sales from our Nordstrom online store in same-store
sales because of the substantial integration of our Nordstrom full-line stores and online store.
2Gross profit is calculated as net sales less cost of sales and related buying and occupancy costs (for all segments).


