Nordstrom 2011 Annual Report Download - page 29
Download and view the complete annual report
Please find page 29 of the 2011 Nordstrom annual report below. You can navigate through the pages in the report by either clicking on the pages listed below, or by using the keyword search tool below to find specific information within the annual report.-
 1
1 -
2
-
3
-
4
-
5
-
6
-
7
-
8
-
9
-
10
-
11
-
12
-
13
-
14
-
15
-
16
-
17
-
18
-
 19
19 -
 20
20 -
 21
21 -
 22
22 -
 23
23 -
 24
24 -
 25
25 -
 26
26 -
 27
27 -
 28
28 -
 29
29 -
 30
30 -
 31
31 -
 32
32 -
 33
33 -
 34
34 -
 35
35 -
 36
36 -
 37
37 -
 38
38 -
 39
39 -
40
-
41
-
42
-
43
-
44
-
45
-
46
-
47
-
48
-
49
-
50
-
51
-
52
-
53
-
54
-
55
-
56
-
57
-
58
-
59
-
60
-
61
-
62
-
63
-
64
-
65
-
66
-
67
-
68
-
69
-
70
-
71
-
72
-
73
-
74
-
75
-
76
-
77
 |
 |

Nordstrom, Inc. and subsidiaries 29
LIQUIDITY AND CAPITAL RESOURCES
We maintain a level of liquidity sufficient to allow us to cover our seasonal cash needs and to maintain appropriate levels of short-term borrowings.
We believe that our operating cash flows, available credit facilities and potential future borrowings are sufficient to finance our cash requirements
for the next 12 months and beyond.
Over the long term, we manage our cash and capital structure to maximize shareholder return, maintain our financial position, manage refinancing
risk and allow flexibility for strategic initiatives. We regularly assess our debt and leverage levels, capital expenditure requirements, debt
service payments, dividend payouts, potential share repurchases and other future investments. We believe our existing cash on-hand, operating
cash flows, available credit facilities and potential future borrowings will be sufficient to fund these scheduled future payments and potential
long-term initiatives.
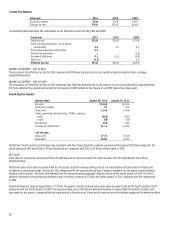
Operating Activities
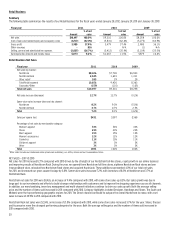
Net cash provided by operating activities was $1,177 in each of 2011 and 2010. The majority of our operating cash inflows are derived from sales. We
also receive cash payments for property incentives from developers. Our operating cash outflows generally consist of payments to our merchandise
vendors (net of vendor allowances), payments to our employees for wages, salaries and other employee benefits and payments to our landlords for
rent. Operating cash outflows also include payments for income taxes and interest payments on our short- and long-term borrowings.
Cash provided by operating activities was flat in 2011 compared with 2010 due to higher sales and earnings offset primarily by changes in working
capital, including increased inventory purchases to align with sales trends.
In 2012, we expect our operating cash flows to increase as a result of higher sales and earnings.
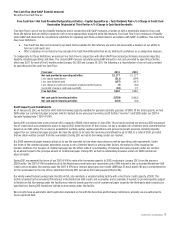
Investing Activities
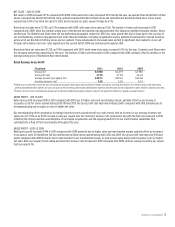
Net cash used in investing activities was $728 in 2011 and $462 in 2010. Our investing cash flows primarily consist of capital expenditures, changes in
restricted cash accumulated for our next debt maturity in April 2012 and changes in credit card receivables associated with cardholder purchases outside
of Nordstrom using our Nordstrom VISA credit cards.
CAPITAL EXPENDITURES
Our capital expenditures over the last three years totaled $1,270, with $511 in 2011, $399 in 2010 and $360 in 2009. Capital expenditures included
investments in new stores, relocations and remodels and information technology improvements.
Capital expenditures increased in 2011 compared with 2010 primarily due to e-commerce and technology investments and the timing of expenditures
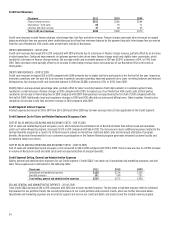
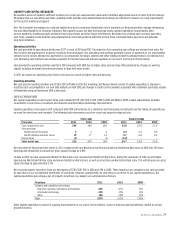
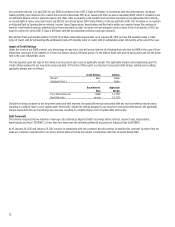
incurred for new stores and remodels. The following table summarizes our store count and square footage activity:
Store count Square footage
Fiscal year 2011 2010 2009 2011 2010 2009
Total, beginning of year 204 184 169 23.8 22.8 21.9
Store openings:
Nordstrom full–line stores 3 3 3 0.4 0.4 0.5
Nordstrom Rack and other stores 19 17 13 0.7 0.6 0.4
Closed stores (1) - (1) (0.2) -
-
Total, end of year 225 204 184 24.7 23.8 22.8
We relocated two Nordstrom Rack stores in 2011, compared with one Nordstrom full-line store and one Nordstrom Rack store in 2010. Our 2011 store
openings and relocations increased our gross square footage by 3.8%.
To date in 2012, we have opened one Nordstrom Rack store and relocated one Nordstrom Rack store. During the remainder of 2012, we anticipate
opening one Nordstrom full-line store and eleven Nordstrom Rack stores, as well as relocating one Nordstrom Rack store. This will increase our gross
square footage by approximately 2.2%.
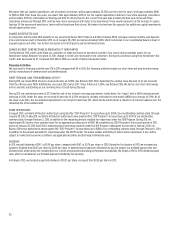
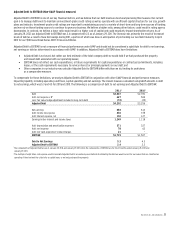
We received property incentives from our developers of $78 in 2011, $95 in 2010 and $96 in 2009. These incentives are included in our cash provided
by operations in our consolidated statements of cash flows. However, operationally we view these as an offset to our capital expenditures. Our
capital expenditure percentages, net of property incentives, by category are summarized as follows:
Fiscal year 2011 2010 2009
Category and expenditure percentage:
New store openings, relocations and remodels 62% 67% 74%
Information technology 20% 15% 13%
Other 18% 18% 13%
Total 100% 100% 100%
Other capital expenditures consist of ongoing improvements to our stores in the ordinary course of business and expenditures related to various
growth initiatives.