Nordstrom 2011 Annual Report Download - page 62
Download and view the complete annual report
Please find page 62 of the 2011 Nordstrom annual report below. You can navigate through the pages in the report by either clicking on the pages listed below, or by using the keyword search tool below to find specific information within the annual report.-
 1
1 -
2
-
3
-
4
-
5
-
6
-
7
-
8
-
9
-
10
-
11
-
12
-
13
-
14
-
15
-
16
-
17
-
18
-
19
-
20
-
21
-
22
-
23
-
24
-
25
-
26
-
27
-
28
-
29
-
30
-
31
-
32
-
33
-
34
-
35
-
36
-
37
-
38
-
39
-
40
-
41
-
42
-
43
-
44
-
45
-
46
-
47
-
48
-
49
-
50
-
51
-
 52
52 -
 53
53 -
 54
54 -
 55
55 -
 56
56 -
 57
57 -
 58
58 -
 59
59 -
 60
60 -
 61
61 -
 62
62 -
 63
63 -
 64
64 -
 65
65 -
 66
66 -
 67
67 -
 68
68 -
 69
69 -
 70
70 -
 71
71 -
 72
72 -
73
-
74
-
75
-
76
-
77
 |
 |

62
Nordstrom, Inc.
Notes to Consolidated Financial Statements
Dollar and share amounts in millions except per share, per option and unit amounts
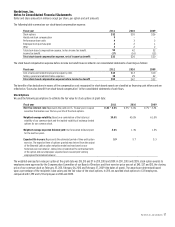
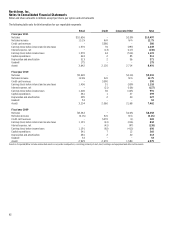
The following table sets forth information for our reportable segments:
Retail Credit Corporate/Other Total
Fiscal year 2011
Net sales
$10,656
—
$(159)
$10,497
Net sales increase 13.1% N/A N/A 12.7%
Credit card revenues — $380 — 380
Earnings (loss) before interest and income taxes 1,570 76 (397) 1,249
Interest expense, net — (13) (117) (130)
Earnings (loss) before income taxes 1,570 63 (514) 1,119
Capital expenditures 424 2 85 511
Depreciation and amortization 313 2 56 371
Goodwill 175 — — 175
Assets1 3,642 2,135 2,714 8,491
Fiscal year 2010
Net sales $9,420 — $(110) $9,310
Net sales increase 12.6% N/A N/A 12.7%
Credit card revenues — $390 — 390
Earnings (loss) before interest and income taxes 1,406 51 (339) 1,118
Interest expense, net — (21) (106) (127)
Earnings (loss) before income taxes 1,406 30 (445) 991
Capital expenditures 361 1 37 399
Depreciation and amortization 295 2 30 327
Goodwill 53 — — 53
Assets1 3,234 2,060 2,168 7,462
Fiscal year 2009
Net sales $8,363 — $(105) $8,258
Net sales decrease (0.1%) N/A N/A (0.2%)
Credit card revenues — $370 (1) 369
Earnings (loss) before interest and income taxes 1,191 (41) (316) 834
Interest expense, net — (41) (97) (138)
Earnings (loss) before income taxes 1,191 (82) (413) 696
Capital expenditures 341 7 12 360
Depreciation and amortization 281 2 30 313
Goodwill 53 — — 53
Assets1 2,929 2,070 1,580 6,579
1Assets in Corporate/Other include unallocated assets in corporate headquarters, consisting primarily of cash, land, buildings and equipment and deferred tax assets.