Nordstrom 2011 Annual Report Download - page 22
Download and view the complete annual report
Please find page 22 of the 2011 Nordstrom annual report below. You can navigate through the pages in the report by either clicking on the pages listed below, or by using the keyword search tool below to find specific information within the annual report.-
 1
1 -
2
-
3
-
4
-
5
-
6
-
7
-
8
-
9
-
10
-
11
-
 12
12 -
 13
13 -
 14
14 -
 15
15 -
 16
16 -
 17
17 -
 18
18 -
 19
19 -
 20
20 -
 21
21 -
 22
22 -
 23
23 -
 24
24 -
 25
25 -
 26
26 -
 27
27 -
 28
28 -
 29
29 -
 30
30 -
 31
31 -
 32
32 -
33
-
34
-
35
-
36
-
37
-
38
-
39
-
40
-
41
-
42
-
43
-
44
-
45
-
46
-
47
-
48
-
49
-
50
-
51
-
52
-
53
-
54
-
55
-
56
-
57
-
58
-
59
-
60
-
61
-
62
-
63
-
64
-
65
-
66
-
67
-
68
-
69
-
70
-
71
-
72
-
73
-
74
-
75
-
76
-
77
 |
 |

22
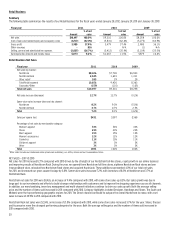
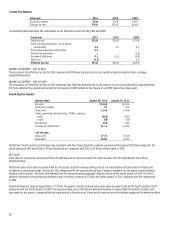
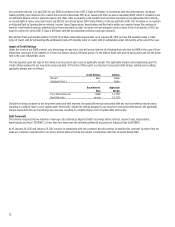
Retail Business Selling, General and Administrative Expenses
Fiscal year 2011 2010 2009
Selling, general and administrative expenses $2,807 $2,412 $2,109
Selling, general and administrative rate 26.7% 25.9% 25.5%
Selling, general and administrative expense per square foot1 $115 $103 $94
1Retail SG&A expense per square foot is calculated as Retail SG&A expense divided by weighted-average square footage. Weighted-average square footage includes a percentage of year-
end square footage for new stores equal to the percentage of the year during which they were open.
SELLING, GENERAL AND ADMINISTRATIVE EXPENSES — 2011 VS 2010
Our Retail selling, general and administrative expenses (“Retail SG&A”) increased $395 in 2011 compared with 2010. This increase reflects initiatives
to improve the shopping experience across all channels and specifically to grow our e-commerce business. These include HauteLook operating and
purchase accounting expenses, planned increases in marketing and technology spending and increased fulfillment expenses associated with the
introduction of free standard shipping and free returns for online purchases in the third quarter of 2011. The increase was also due in part to higher
sales volume and the opening of twenty-two stores in 2011. As a result, our Retail SG&A rate increased 84 basis points for 2011 compared with 2010.
We continue to leverage SG&A expense in our stores, with improvements of approximately 35 basis points in 2011, compared with 2010.
SELLING, GENERAL AND ADMINISTRATIVE EXPENSES — 2010 VS 2009
Our Retail selling, general and administrative expenses increased $303 in 2010 compared with 2009. The majority of the increase in expense dollars
was due to higher sales volume and expenses for new stores. Our Retail SG&A rate increased 38 basis points for 2010 compared with 2009. The
increase was in part due to planned increases in marketing and technology expenses in areas such as online marketing and social media. The
increased Retail SG&A rate also reflects higher fulfillment costs as we shipped more items to our customers.