Nordstrom 2011 Annual Report Download - page 25
Download and view the complete annual report
Please find page 25 of the 2011 Nordstrom annual report below. You can navigate through the pages in the report by either clicking on the pages listed below, or by using the keyword search tool below to find specific information within the annual report.-
 1
1 -
2
-
3
-
4
-
5
-
6
-
7
-
8
-
9
-
10
-
11
-
12
-
13
-
14
-
 15
15 -
 16
16 -
 17
17 -
 18
18 -
 19
19 -
 20
20 -
 21
21 -
 22
22 -
 23
23 -
 24
24 -
 25
25 -
 26
26 -
 27
27 -
 28
28 -
 29
29 -
 30
30 -
 31
31 -
 32
32 -
 33
33 -
 34
34 -
 35
35 -
36
-
37
-
38
-
39
-
40
-
41
-
42
-
43
-
44
-
45
-
46
-
47
-
48
-
49
-
50
-
51
-
52
-
53
-
54
-
55
-
56
-
57
-
58
-
59
-
60
-
61
-
62
-
63
-
64
-
65
-
66
-
67
-
68
-
69
-
70
-
71
-
72
-
73
-
74
-
75
-
76
-
77
 |
 |

Nordstrom, Inc. and subsidiaries 25
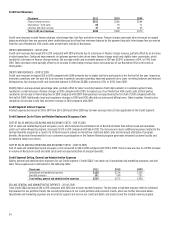
SELLING, GENERAL AND ADMINISTRATIVE EXPENSES — 2010 VS 2009
Total Credit SG&A decreased $83 in 2010 compared with 2009, due primarily to lower bad debt expense, partially offset by increases in operational
and marketing expenses. The decrease in bad debt expense reflected continued improvement in our portfolio trends which are further discussed
below. The increase in operational and marketing expenses was primarily driven by increased information technology expenses, higher collection
agency fees from higher recoveries and expenses related to our Fashion Rewards program.
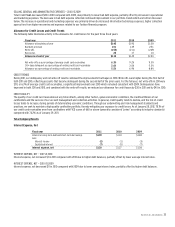
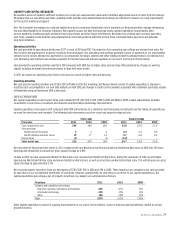
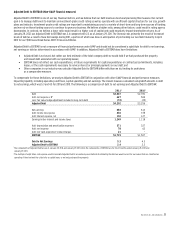
Allowance for Credit Losses and Credit Trends
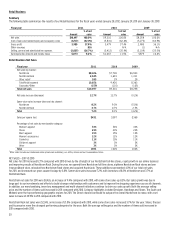
The following table illustrates activity in the allowance for credit losses for the past three fiscal years:
Fiscal year 2011 2010 2009
Allowance at beginning of year $145 $190 $138
Bad debt provision 101 149 251
Write–offs (153) (211) (209)
Recoveries 22 17 10
Allowance at end of year $115 $145 $190
Net write–offs as a percentage of average credit card receivables 6.3% 9.2% 9.5%
30+ days delinquent as a percentage of ending credit card receivables 2.6%
3.0% 5.3%
Allowance as a percentage of ending credit card receivables 5.5% 6.9% 8.8%
CREDIT TRENDS
During 2011, our delinquency and net write-off results continued the improvements that began in 2010. Write-offs were higher during the first half of
both 2011 and 2010, reflecting accounts that became delinquent during the second half of the prior years. For the full year, net write-offs in 2011 were
$131, or 6.3% of average credit card receivables, a significant improvement over 2010 which remained consistent with 2009. Delinquencies have
improved in both 2011 and 2010, and combined with the write-off results, we reduced our allowance for credit losses by $30 in 2011 and by $45 in 2010.
CREDIT QUALITY
The quality of our credit card receivables at any time reflects, among other factors, general economic conditions, the creditworthiness of our
cardholders and the success of our account management and collection activities. In general, credit quality tends to decline, and the risk of credit
losses tends to increase, during periods of deteriorating economic conditions. Through our underwriting and risk management standards and
practices, we seek to maintain a high quality cardholder portfolio, thereby mitigating our exposure to credit losses. As of January 28, 2012, 78.1% of
our credit card receivables were from cardholders with FICO scores of 660 or above (generally considered “prime” according to industry standards)
compared with 76.2% as of January 29, 2011.
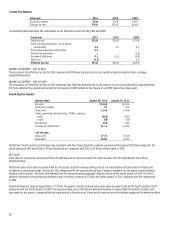
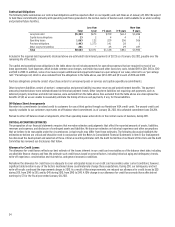
Total Company Results
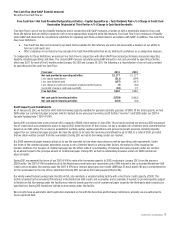
Interest Expense, Net
Fiscal year 2011 2010 2009
Interest on long–term debt and short–term borrowings
$139 $133 $148
Less:
Interest income (2)
(1)
(3)
Capitalized interest (7)
(5)
(7)
Interest expense, net $130 $127 $138
INTEREST EXPENSE, NET — 2011 VS 2010
Interest expense, net increased $3 in 2011 compared with 2010 due to higher debt balances, partially offset by lower average interest rates.
INTEREST EXPENSE, NET — 2010 VS 2009
Interest expense, net decreased $11 in 2010 compared with 2009 due to lower average interest rates, partially offset by higher debt balances.