Nordstrom 2011 Annual Report Download - page 49
Download and view the complete annual report
Please find page 49 of the 2011 Nordstrom annual report below. You can navigate through the pages in the report by either clicking on the pages listed below, or by using the keyword search tool below to find specific information within the annual report.-
 1
1 -
2
-
3
-
4
-
5
-
6
-
7
-
8
-
9
-
10
-
11
-
12
-
13
-
14
-
15
-
16
-
17
-
18
-
19
-
20
-
21
-
22
-
23
-
24
-
25
-
26
-
27
-
28
-
29
-
30
-
31
-
32
-
33
-
34
-
35
-
36
-
37
-
38
-
 39
39 -
 40
40 -
 41
41 -
 42
42 -
 43
43 -
 44
44 -
 45
45 -
 46
46 -
 47
47 -
 48
48 -
 49
49 -
 50
50 -
 51
51 -
 52
52 -
 53
53 -
 54
54 -
 55
55 -
 56
56 -
 57
57 -
 58
58 -
 59
59 -
60
-
61
-
62
-
63
-
64
-
65
-
66
-
67
-
68
-
69
-
70
-
71
-
72
-
73
-
74
-
75
-
76
-
77
 |
 |
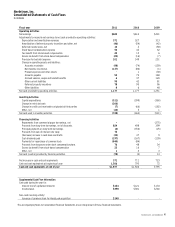
Nordstrom, Inc. and subsidiaries 49
Nordstrom, Inc.
Notes to Consolidated Financial Statements
Dollar and share amounts in millions except per share, per option and unit amounts
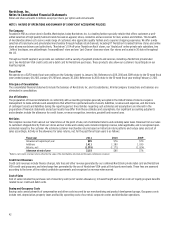
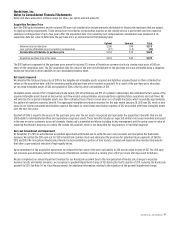
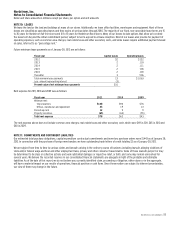
Credit Quality
The primary indicators of the credit quality of our credit card receivables are aging and delinquency, particularly the levels of account balances
delinquent 30 days or more as these are the accounts most likely to be written off. The following table illustrates the aging and delinquency status
of our credit card receivables:
January 28, 2012 January 29, 2011
Balance % of Total Balance % of Total
Current $1,928 93.0% $1,942 92.4%
1 – 29 days delinquent 92 4.4% 97 4.6%
30+ days delinquent:
30 – 59 days delinquent 20 1.0% 24 1.1%
60 – 89 days delinquent 13 0.6% 17 0.8%
90 days or more delinquent 21 1.0% 23 1.1%
Total 30+ days delinquent 54 2.6% 64 3.0%
Total credit card receivables $2,074 100.0% $2,103 100.0%
Receivables not accruing finance charges $15 $14
Receivables 90 days or more delinquent
and still accruing finance charges
$11
$21
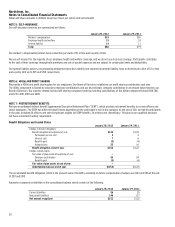
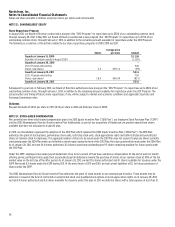
We also evaluate credit quality using FICO credit scores. The following table illustrates the distribution of our credit card receivables across FICO
score ranges:
January 28, 2012 January 29, 2011
FICO Score Range1 Balance % of Total Balance % of Total
801+ $307 14.8% $314 14.9%
720 – 800 741 35.7% 731 34.8%
660 – 719 572 27.6% 558 26.5%
600 – 659 270 13.0% 274 13.0%
001 – 599 120 5.8% 155 7.4%
Other2 64 3.1% 71 3.4%
Total credit card receivables $2,074 100.0% $2,103 100.0%
1Credit scores for our cardholders are updated at least every 60 days. Amounts listed in the table reflect the most recently obtained credit scores as of the dates indicated.
2Other consists of amounts not yet posted to customers’ accounts and receivables from customers for whom FICO scores are temporarily unavailable.
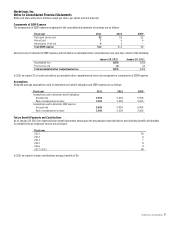
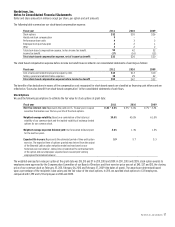
NOTE 4: LAND, BUILDINGS AND EQUIPMENT
Land, buildings and equipment consist of the following:
January 28, 2012 January 29, 2011
Land and land improvements $76 $72
Buildings and building improvements 960 919
Leasehold improvements 2,062 1,914
Store fixtures and equipment 2,528 2,341
Capitalized software 461 404
Construction in progress 173 188
Land, buildings and equipment 6,260 5,838
Less: accumulated depreciation and amortization (3,791) (3,520)
Land, buildings and equipment, net $2,469 $2,318
The total cost of buildings and equipment held under capital lease obligations was $28 at the end of both 2011 and 2010, with related accumulated
amortization of $23 in both 2011 and 2010. The amortization of capitalized leased buildings and equipment of $1 in both 2011 and 2010 was recorded in
depreciation expense.