Nordstrom 2011 Annual Report Download - page 16
Download and view the complete annual report
Please find page 16 of the 2011 Nordstrom annual report below. You can navigate through the pages in the report by either clicking on the pages listed below, or by using the keyword search tool below to find specific information within the annual report.-
 1
1 -
2
-
3
-
4
-
5
-
 6
6 -
 7
7 -
 8
8 -
 9
9 -
 10
10 -
 11
11 -
 12
12 -
 13
13 -
 14
14 -
 15
15 -
 16
16 -
 17
17 -
 18
18 -
 19
19 -
 20
20 -
 21
21 -
 22
22 -
 23
23 -
 24
24 -
 25
25 -
 26
26 -
27
-
28
-
29
-
30
-
31
-
32
-
33
-
34
-
35
-
36
-
37
-
38
-
39
-
40
-
41
-
42
-
43
-
44
-
45
-
46
-
47
-
48
-
49
-
50
-
51
-
52
-
53
-
54
-
55
-
56
-
57
-
58
-
59
-
60
-
61
-
62
-
63
-
64
-
65
-
66
-
67
-
68
-
69
-
70
-
71
-
72
-
73
-
74
-
75
-
76
-
77
 |
 |
16
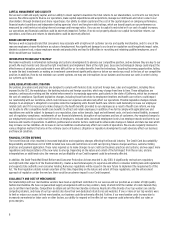
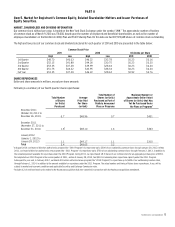
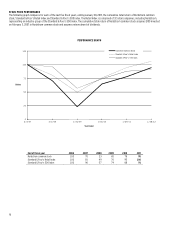
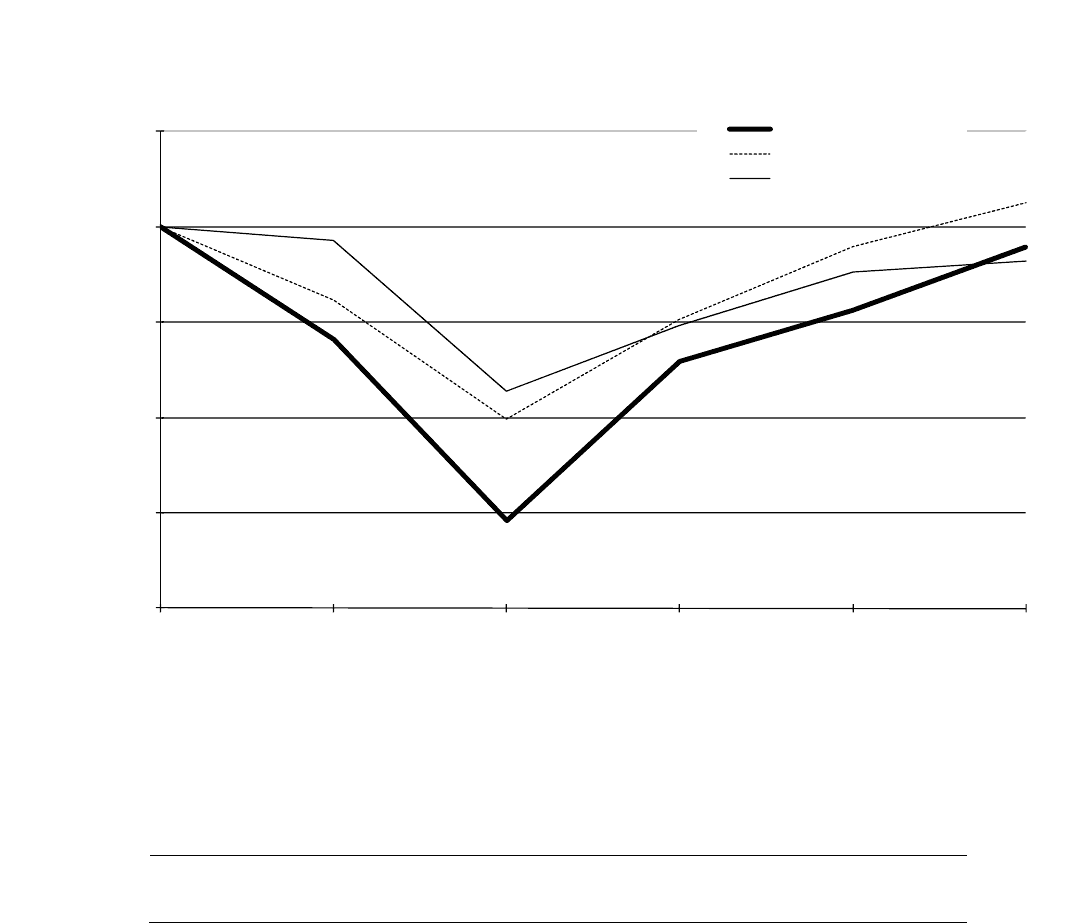
STOCK PRICE PERFORMANCE
The following graph compares for each of the last five fiscal years, ending January 28, 2012, the cumulative total return of Nordstrom common
stock, Standard & Poor’s Retail Index and Standard & Poor’s 500 Index. The Retail Index is comprised of 32 retail companies, including Nordstrom,
representing an industry group of the Standard & Poor’s 500 Index. The cumulative total return of Nordstrom common stock assumes $100 invested
on February 3, 2007 in Nordstrom common stock and assumes reinvestment of dividends.
End of fiscal year 2006 2007 2008 2009 2010 2011
Nordstrom common stock 100 70 23 65 78 95
Standard & Poor’s Retail Index 100 81 49 76 95 106
Standard & Poor’s 500 Index 100 96 57 74 88 91
0
25
50
75
100
125
2/3/07 2/2/08 1/31/09 1/30/10 1/29/11 1/28/12
Dollars
Year Ended
PERFORMANCE GRAPH
Nordstrom Common Stock
Standard & Poor's Retail Index
Standard & Poor's 500 Index