Nordstrom 2011 Annual Report Download - page 21
Download and view the complete annual report
Please find page 21 of the 2011 Nordstrom annual report below. You can navigate through the pages in the report by either clicking on the pages listed below, or by using the keyword search tool below to find specific information within the annual report.-
 1
1 -
2
-
3
-
4
-
5
-
6
-
7
-
8
-
9
-
10
-
 11
11 -
 12
12 -
 13
13 -
 14
14 -
 15
15 -
 16
16 -
 17
17 -
 18
18 -
 19
19 -
 20
20 -
 21
21 -
 22
22 -
 23
23 -
 24
24 -
 25
25 -
 26
26 -
 27
27 -
 28
28 -
 29
29 -
 30
30 -
 31
31 -
32
-
33
-
34
-
35
-
36
-
37
-
38
-
39
-
40
-
41
-
42
-
43
-
44
-
45
-
46
-
47
-
48
-
49
-
50
-
51
-
52
-
53
-
54
-
55
-
56
-
57
-
58
-
59
-
60
-
61
-
62
-
63
-
64
-
65
-
66
-
67
-
68
-
69
-
70
-
71
-
72
-
73
-
74
-
75
-
76
-
77
 |
 |

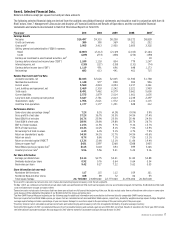
Nordstrom, Inc. and subsidiaries 21
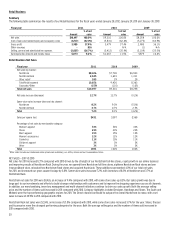
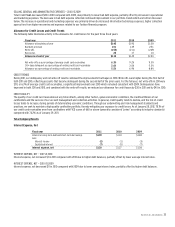
NET SALES — 2010 VS 2009
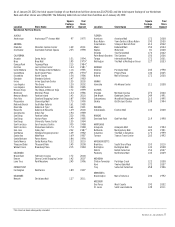
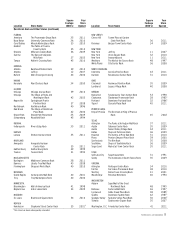
Net sales for 2010 increased 12.7% compared with 2009, while same-store sales increased 8.1%. During the year, we opened three Nordstrom full-line
stores, relocated one Nordstrom full-line store, opened seventeen Nordstrom Rack stores and relocated one Nordstrom Rack store. These stores
represented 3.3% of our total net sales for 2010, and increased our gross square footage by 4.7%.
Nordstrom net sales were $7,700, up 11.2% compared with 2009, with same-store sales up 9.3%. The number of items sold increased in 2010
compared with 2009, while the average selling price of Nordstrom merchandise was approximately flat. Category highlights included Jewelry, Shoes
and Dresses. The Midwest and South were the top-performing geographic regions for 2010. Our sales growth was due in large part to the success of
our merchandising, inventory management and multi-channel initiatives, including an updated inventory platform that allowed for shared inventory
across all of our Nordstrom full-line stores and our website. These enhancements increased sales and led to significant improvements in our sell-
through and inventory turnover rates beginning in the second half of 2009 and continuing throughout 2010.
Nordstrom Rack net sales were $1,720, up 19.5% compared with 2009, while same-store sales increased 0.7% for the year. Cosmetics and Shoes were
the strongest performing categories for the year. The number of items sold increased in 2010 compared with 2009, partially offset by declines in the
average selling price of Nordstrom Rack merchandise.
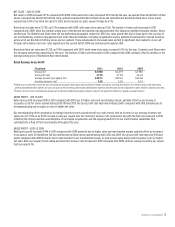
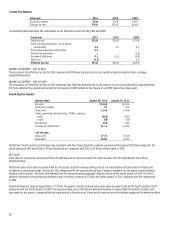
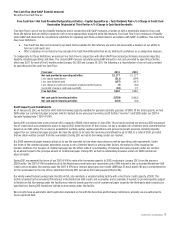
Retail Business Gross Profit
Fiscal year 2011 2010 2009
Gross profit1 $3,980 $3,479 $2,985
Gross profit rate 37.9% 37.4% 36.1%
Average inventory per square foot $48.71 $45.31 $43.96
Inventory turnover rate2 5.56 5.56 5.41
1Retailers do not uniformly record the costs of buying and occupancy and supply chain operations (freight, purchasing, receiving, distribution, etc.) between gross profit and selling,
general and administrative expense. As such, our gross profit and selling, general and administrative expenses and rates may not be comparable to other retailers’ expenses and rates.
2Inventory turnover rate is calculated as annual cost of sales and related buying and occupancy costs (for all segments) divided by 4-quarter average inventory.
GROSS PROFIT — 2011 VS 2010
Retail gross profit increased $501 in 2011 compared with 2010 due to higher sales and merchandise margin, partially offset by an increase in
occupancy costs for stores opened during both 2011 and 2010. Our gross profit rate improved 54 basis points compared with 2010 primarily due to
leveraging buying and occupancy costs on higher net sales.
Our merchandising efforts enabled us to manage inventory levels consistent with our sales trends, with an increase in our average inventory per
square foot of 7.5% on an 8.5% increase in sales per square foot. Our inventory turnover rate remained in-line with the high rate achieved in 2010,
reflecting the strong execution and discipline of our buying organization and the ongoing benefits from our multi-channel capabilities that
contributed to a flow of fresh merchandise throughout the year.
GROSS PROFIT — 2010 VS 2009
Retail gross profit increased $494 in 2010 compared with 2009 primarily due to higher sales and merchandise margin, partially offset by increases
in occupancy costs for Nordstrom full-line and Nordstrom Rack stores opened during both 2010 and 2009. Our gross profit rate improved 123 basis
points compared with 2009 primarily due to improvement in our merchandise margin, as well as leveraging buying and occupancy costs on higher
net sales. Both our regular-priced selling and inventory turnover rate increased in 2010 compared with 2009, and our average inventory per square
foot increased 3.1%.