Nordstrom 2011 Annual Report Download - page 48
Download and view the complete annual report
Please find page 48 of the 2011 Nordstrom annual report below. You can navigate through the pages in the report by either clicking on the pages listed below, or by using the keyword search tool below to find specific information within the annual report.-
 1
1 -
2
-
3
-
4
-
5
-
6
-
7
-
8
-
9
-
10
-
11
-
12
-
13
-
14
-
15
-
16
-
17
-
18
-
19
-
20
-
21
-
22
-
23
-
24
-
25
-
26
-
27
-
28
-
29
-
30
-
31
-
32
-
33
-
34
-
35
-
36
-
37
-
 38
38 -
 39
39 -
 40
40 -
 41
41 -
 42
42 -
 43
43 -
 44
44 -
 45
45 -
 46
46 -
 47
47 -
 48
48 -
 49
49 -
 50
50 -
 51
51 -
 52
52 -
 53
53 -
 54
54 -
 55
55 -
 56
56 -
 57
57 -
 58
58 -
59
-
60
-
61
-
62
-
63
-
64
-
65
-
66
-
67
-
68
-
69
-
70
-
71
-
72
-
73
-
74
-
75
-
76
-
77
 |
 |

48
Nordstrom, Inc.
Notes to Consolidated Financial Statements
Dollar and share amounts in millions except per share, per option and unit amounts
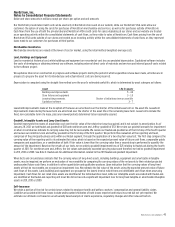
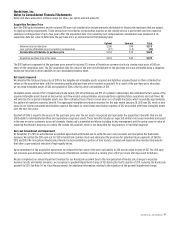
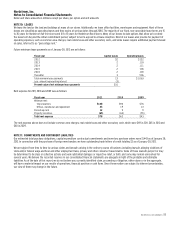
NOTE 3: ACCOUNTS RECEIVABLE
The components of accounts receivable are as follows:
January 28, 2012 January 29, 2011
Credit card receivables:
Nordstrom VISA credit card receivables $1,347 $1,431
Nordstrom private label card receivables 727 672
Total credit card receivables 2,074 2,103
Allowance for credit losses (115) (145)
Credit card receivables, net 1,959 1,958
Other accounts receivable 74 68
Accounts receivable, net $2,033 $2,026
Our credit card receivables are restricted under our securitization program. Our Series 2007-2 Class A & B Notes, Series 2011-1 Class A Notes and the
2007-A Variable Funding Note are secured by 100% of the Nordstrom private label credit card receivables and 90% of the Nordstrom VISA credit
card receivables, while the remaining 10% of the Nordstrom VISA credit card receivables secure the variable funding credit facility held by our
wholly owned federal savings bank, Nordstrom fsb. As of January 28, 2012 and January 29, 2011, our restricted credit card receivables included more
receivables than necessary to collateralize our outstanding secured debt and variable funding facilities, and as such can be utilized to increase the
current usage of our securitization program. Our credit card securitization agreements set a maximum percentage of receivables that can be
associated with various receivable categories, such as employee or foreign receivables, and as of January 28, 2012 and January 29, 2011 these
maximums were not exceeded.
Other accounts receivable consist primarily of credit and debit card receivables due from third-party financial institutions.
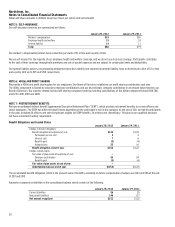
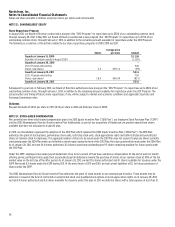
Activity in the allowance for credit losses for the past three fiscal years is as follows:
Fiscal year 2011 2010 2009
Allowance at beginning of year $145 $190 $138
Bad debt provision 101 149 251
Write–offs (153) (211) (209)
Recoveries 22 17 10
Allowance at end of year $115 $145 $190
For purposes of determining impairment and recording the associated allowance for credit losses, we evaluate our credit card receivables on a
collective basis as they are composed of large groups of smaller-balance homogeneous loans and, therefore, are not individually evaluated
for impairment.
Under certain circumstances, we may make modifications to payment terms for a customer experiencing financial difficulties in an effort to help the
customer avoid bankruptcy and to maximize our recovery of the outstanding balance. These modifications, which meet the definition of troubled
debt restructurings (“TDRs”), include reduced or waived fees and finance charges, and/or reduced minimum payments. Receivables classified as
TDRs were $58, or 2.8% of our total credit card receivables as of January 28, 2012 and $56, or 2.7% of our total credit card receivables as of
January 29, 2011. As with other aged receivables in our portfolio, the allowance for credit losses related to receivables classified as TDRs is primarily
based on our historical aging and delinquency trends and write-off experience, with qualitative consideration of factors affecting the credit quality
of our portfolio, including amounts of and trends in TDRs.