Nordstrom 2011 Annual Report Download - page 28
Download and view the complete annual report
Please find page 28 of the 2011 Nordstrom annual report below. You can navigate through the pages in the report by either clicking on the pages listed below, or by using the keyword search tool below to find specific information within the annual report.-
 1
1 -
2
-
3
-
4
-
5
-
6
-
7
-
8
-
9
-
10
-
11
-
12
-
13
-
14
-
15
-
16
-
17
-
 18
18 -
 19
19 -
 20
20 -
 21
21 -
 22
22 -
 23
23 -
 24
24 -
 25
25 -
 26
26 -
 27
27 -
 28
28 -
 29
29 -
 30
30 -
 31
31 -
 32
32 -
 33
33 -
 34
34 -
 35
35 -
 36
36 -
 37
37 -
 38
38 -
39
-
40
-
41
-
42
-
43
-
44
-
45
-
46
-
47
-
48
-
49
-
50
-
51
-
52
-
53
-
54
-
55
-
56
-
57
-
58
-
59
-
60
-
61
-
62
-
63
-
64
-
65
-
66
-
67
-
68
-
69
-
70
-
71
-
72
-
73
-
74
-
75
-
76
-
77
 |
 |

28
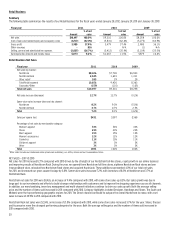
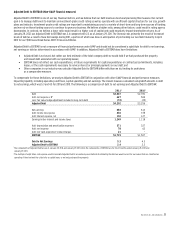
Return on Invested Capital (“ROIC”) (Non-GAAP financial measure)
We define ROIC as follows:
We believe that ROIC is a useful financial measure for investors in evaluating our operating performance. When analyzed in conjunction with our net
earnings and total assets and compared with return on assets (net earnings divided by average total assets), it provides investors with a useful tool
to evaluate our ongoing operations and our management of assets from period to period. ROIC is one of our key financial metrics, and we also
incorporate it into our executive incentive measures. We believe that overall performance as measured by ROIC correlates directly to shareholders’
return over the long term. For the 12 fiscal months ended January 28, 2012, our ROIC decreased to 13.3% compared with 13.6% for the 12 fiscal
months ended January 29, 2011. ROIC is not a measure of financial performance under GAAP, should not be considered a substitute for return on
assets, net earnings or total assets as determined in accordance with GAAP, and may not be comparable with similarly titled measures reported
by other companies. The closest measure calculated using GAAP amounts is return on assets, which increased to 8.7% from 8.6% for the 12 fiscal
months ended January 28, 2012, compared with the 12 fiscal months ended January 29, 2011. The following is a comparison of return on assets
to ROIC:
12 fiscal months ended
January 28, 2012 January 29, 2011
Net earnings $683 $613
Add: income tax expense 436 378
Add: interest expense 132 128
Earnings before interest and income tax expense 1,251 1,119
Add: rent expense 78 62
Less: estimated depreciation on capitalized operating leases1 (42) (32)
Net operating profit 1,287 1,149
Estimated income tax expense2 (501) (439)
Net operating profit after tax $786 $710
Average total assets3 $7,890 $7,091
Less: average non–interest–bearing current liabilities4 (2,041) (1,796)
Less: average deferred property incentives3 (504) (487)
Add: average estimated asset base of capitalized
operating leases5 555 425
Average invested capital $5,900 $5,233
Return on assets 8.7% 8.6%
ROIC 13.3% 13.6%
1Capitalized operating leases is our best estimate of the asset base we would record for our leases that are classified as operating if they had met the criteria for a capital lease, or we
purchased the property. Asset base is calculated as described in footnote 5 below.
2Based upon our effective tax rate multiplied by the net operating profit for the 12 fiscal months ended January 28, 2012 and January 29, 2011.
3Based upon the trailing 12-month average, including cash and cash equivalents.
4Based upon the trailing 12-month average for accounts payable, accrued salaries, wages and related benefits, and other current liabilities.
5Based upon the trailing 12-month average of the monthly asset base, which is calculated as the trailing 12-months rent expense multiplied by eight. The multiple of eight times rent
expense is a commonly used method of estimating the asset base we would record for our capitalized operating leases described in footnote 1.
Our ROIC decreased compared with the prior year primarily due to an increase in our average invested capital, attributable primarily to growth in
cash and cash equivalents. This was partly offset by an increase in our net operating profit after tax.
ROIC = Net Operating Profit After Taxes
Average Invested Capital