Nordstrom 2011 Annual Report Download - page 57
Download and view the complete annual report
Please find page 57 of the 2011 Nordstrom annual report below. You can navigate through the pages in the report by either clicking on the pages listed below, or by using the keyword search tool below to find specific information within the annual report.-
 1
1 -
2
-
3
-
4
-
5
-
6
-
7
-
8
-
9
-
10
-
11
-
12
-
13
-
14
-
15
-
16
-
17
-
18
-
19
-
20
-
21
-
22
-
23
-
24
-
25
-
26
-
27
-
28
-
29
-
30
-
31
-
32
-
33
-
34
-
35
-
36
-
37
-
38
-
39
-
40
-
41
-
42
-
43
-
44
-
45
-
46
-
 47
47 -
 48
48 -
 49
49 -
 50
50 -
 51
51 -
 52
52 -
 53
53 -
 54
54 -
 55
55 -
 56
56 -
 57
57 -
 58
58 -
 59
59 -
 60
60 -
 61
61 -
 62
62 -
 63
63 -
 64
64 -
 65
65 -
 66
66 -
 67
67 -
68
-
69
-
70
-
71
-
72
-
73
-
74
-
75
-
76
-
77
 |
 |

Nordstrom, Inc. and subsidiaries 57
Nordstrom, Inc.
Notes to Consolidated Financial Statements
Dollar and share amounts in millions except per share, per option and unit amounts
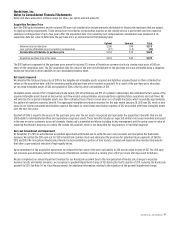
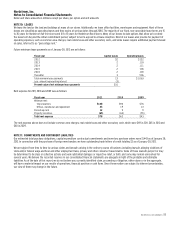
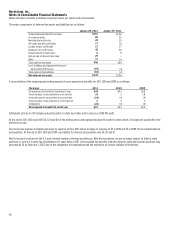
The following table summarizes our stock-based compensation expense:
Fiscal year
2011 2010 2009
Stock options
$32
$35 $26
HauteLook stock compensation
9 - -
Performance share units
4 3 3
Employee stock purchase plan
2 2 1
Other
3 2 2
Total stock–based compensation expense, before income tax benefit
50 42 32
Income tax benefit
(17)
(16) (12)
Total stock-based compensation expense, net of income tax benefit
$33
$26 $20
The stock-based compensation expense before income tax benefit was recorded in our consolidated statements of earnings as follows:
Fiscal year
2011 2010 2009
Cost of sales and related buying and occupancy costs
$12
$13 $10
Selling, general and administrative expenses
38 29 22
Total stock-based compensation expense before income tax benefit
$50
$42 $32
The benefits of tax deductions in excess of the compensation cost recognized for stock-based awards are classified as financing cash inflows and are
reflected as “Excess tax benefit from stock-based compensation” in the consolidated statements of cash flows.
Stock Options
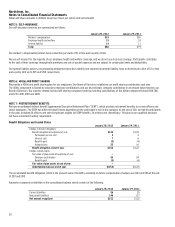
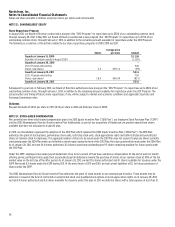
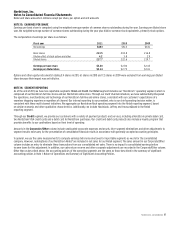
We used the following assumptions to estimate the fair value for stock options at grant date:
Fiscal year 2011
2010 2009
Risk-free interest rate: Represents the yield on U.S. Treasury zero–coupon
securities that mature over the ten–year life of the stock options.
0.4% - 3.5%
0.5% - 4.0% 0.7% - 3.3%
Weighted-average volatility: Based on a combination of the historical
volatility of our common stock and the implied volatility of exchange traded
options for our common stock.
39.0%
40.0% 61.0%
Weighted-average expected dividend yield: Our forecasted dividend yield
for the next ten years.
2.0%
1.3% 1.3%
Expected life in years: Represents the estimated period of time until option
exercise. The expected term of options granted was derived from the output
of the Binomial Lattice option valuation model and was based on our
historical exercise behavior, taking into consideration the contractual term
of the option and our employees’ expected exercise and post–vesting
employment termination behavior.
5.9
5.7 5.3
The weighted-average fair value per option at the grant date was $15, $13 and $7 in 2011, 2010 and 2009. In 2011, 2010 and 2009, stock option awards to
employees were approved by the Compensation Committee of our Board of Directors and their exercise price was set at $45, $37 and $13, the closing
price of our common stock on February 25, 2011, February 26, 2010 and February 27, 2009 (the dates of grant). The awards are determined based
upon a percentage of the recipients’ base salary and the fair value of the stock options. In 2011, we awarded stock options to 1,331 employees,
compared with 1,259 and 1,213 employees in 2010 and 2009.