Nordstrom 2011 Annual Report Download - page 59
Download and view the complete annual report
Please find page 59 of the 2011 Nordstrom annual report below. You can navigate through the pages in the report by either clicking on the pages listed below, or by using the keyword search tool below to find specific information within the annual report.-
 1
1 -
2
-
3
-
4
-
5
-
6
-
7
-
8
-
9
-
10
-
11
-
12
-
13
-
14
-
15
-
16
-
17
-
18
-
19
-
20
-
21
-
22
-
23
-
24
-
25
-
26
-
27
-
28
-
29
-
30
-
31
-
32
-
33
-
34
-
35
-
36
-
37
-
38
-
39
-
40
-
41
-
42
-
43
-
44
-
45
-
46
-
47
-
48
-
 49
49 -
 50
50 -
 51
51 -
 52
52 -
 53
53 -
 54
54 -
 55
55 -
 56
56 -
 57
57 -
 58
58 -
 59
59 -
 60
60 -
 61
61 -
 62
62 -
 63
63 -
 64
64 -
 65
65 -
 66
66 -
 67
67 -
 68
68 -
 69
69 -
70
-
71
-
72
-
73
-
74
-
75
-
76
-
77
 |
 |

Nordstrom, Inc. and subsidiaries 59
Nordstrom, Inc.
Notes to Consolidated Financial Statements
Dollar and share amounts in millions except per share, per option and unit amounts
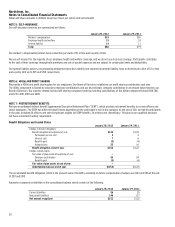
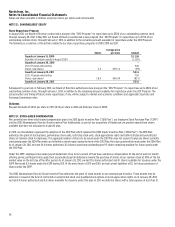
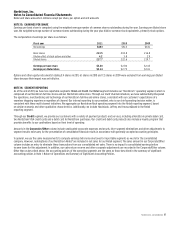
Following is a summary of performance share unit activity:
Fiscal year 2011
Outstanding, beginning of year 199,186
Granted 60,934
Vested but unearned -
Vested and earned (132,752)
Cancelled -
Outstanding, end of year 127,368
Total fair value of performance share units earned $6
Total fair value of performance share units settled
or to be settled in cash $6
As of January 28, 2012, our other liabilities included $7 for performance share units. As of January 28, 2012, the remaining unrecognized stock-based
compensation expense for unvested performance share units was $2, which is expected to be recognized over a weighted-average period of
24 months.
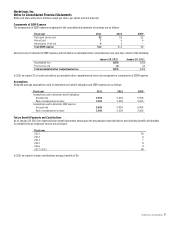
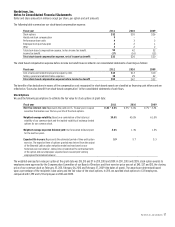
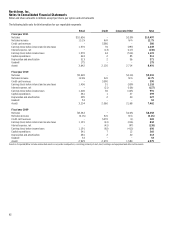
NOTE 14: INCOME TAXES
Income tax expense consists of the following:
Fiscal year 2011 2010 2009
Current income taxes:
Federal $359 $324 $275
State and local 63 52 38
Total current income tax expense 422 376 313
Deferred income taxes:
Current 7 2 (28)
Non–current 7 - (30)
Total deferred income tax expense (benefit) 14 2 (58)
Total income tax expense $436 $378 $255
A reconciliation of the statutory Federal income tax rate to the effective tax rate on earnings before income taxes is as follows:
Fiscal year 2011 2010 2009
Statutory rate 35.0% 35.0% 35.0%
State and local income taxes, net of federal
income taxes 3.6 3.4 3.5
Non–taxable acquisition–related items 0.6 - -
Deferred tax adjustment – - (1.8)
Permanent differences 0.1 (0.2) (0.6)
Other, net (0.3) - 0.5
Effective tax rate 39.0% 38.2% 36.6%
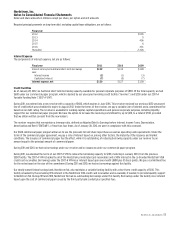
In 2009, the IRS completed its routine examination of our federal filings for 2007. As a result of adjustments identified in the IRS examinations
and revisions of estimates, we increased our deferred tax assets, which resulted in a reduction in our effective tax rate in 2009.
In 2011, we acquired HauteLook in a tax-free merger transaction. The non-taxability of certain acquisition-related items, including goodwill
impairment, resulted in an increase in our effective tax rate in 2011.