Nordstrom 2011 Annual Report Download - page 27
Download and view the complete annual report
Please find page 27 of the 2011 Nordstrom annual report below. You can navigate through the pages in the report by either clicking on the pages listed below, or by using the keyword search tool below to find specific information within the annual report.-
 1
1 -
2
-
3
-
4
-
5
-
6
-
7
-
8
-
9
-
10
-
11
-
12
-
13
-
14
-
15
-
16
-
 17
17 -
 18
18 -
 19
19 -
 20
20 -
 21
21 -
 22
22 -
 23
23 -
 24
24 -
 25
25 -
 26
26 -
 27
27 -
 28
28 -
 29
29 -
 30
30 -
 31
31 -
 32
32 -
 33
33 -
 34
34 -
 35
35 -
 36
36 -
 37
37 -
38
-
39
-
40
-
41
-
42
-
43
-
44
-
45
-
46
-
47
-
48
-
49
-
50
-
51
-
52
-
53
-
54
-
55
-
56
-
57
-
58
-
59
-
60
-
61
-
62
-
63
-
64
-
65
-
66
-
67
-
68
-
69
-
70
-
71
-
72
-
73
-
74
-
75
-
76
-
77
 |
 |

Nordstrom, Inc. and subsidiaries 27
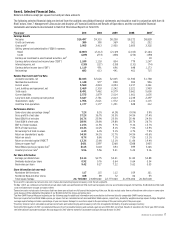
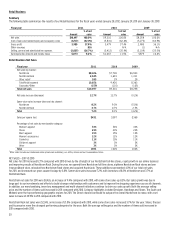
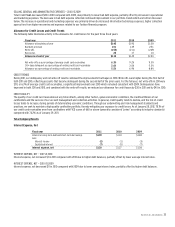
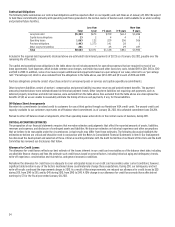
GROSS PROFIT
Our gross profit rate increased 12 basis points to 37.7% from 37.6% last year. The increase was driven by the ability to leverage buying and
occupancy expenses. Our average inventory per square foot increased 11.9% on an 8.4% increase in sales per square foot compared with the fourth
quarter of 2010. The higher increase in inventory per square foot, compared with the increase in sales per square foot, resulted from growing our
inventory to what we consider to be an appropriate level to support our anticipated sales volume in the coming months.
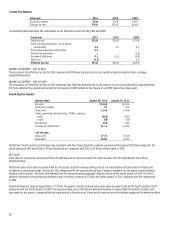
SELLING, GENERAL & ADMINISTRATIVE EXPENSES
Selling, general and administrative expenses for our Retail Business increased $121 compared with last year’s fourth quarter. The increase was
primarily attributable to various customer facing e-commerce initiatives, including HauteLook, and sales growth in both existing and new stores. Our
Retail SG&A rate increased approximately 107 basis points, driven primarily by HauteLook, including the impact of goodwill impairment.
In the fourth quarter, selling, general and administrative expenses for our Credit segment were $58, slightly up from $55 in 2010. The increase was
primarily driven by higher collection agency fees from increased recovery efforts and an increase in information technology and marketing
expenses, partially offset by lower bad debt expense resulting from continued improvements in our credit trends.
For further information on our quarterly results in 2011 and 2010, refer to Note 17: Selected Quarterly Data in the Notes to Consolidated Financial
Statements in Item 8.
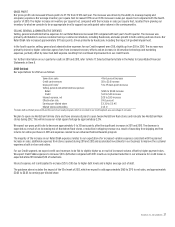
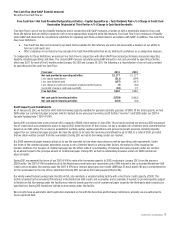
2012 Outlook
Our expectations for 2012 are as follows:
Same–store sales 4 to 6 percent increase
Credit card revenues $0 to $10 increase
Gross profit rate1 5 to 35 basis point decrease
Selling, general and administrative expenses:
Retail $265 to $330 increase
Credit $10 to $20 increase
Interest expense, net $25 to $30 increase
Effective tax rate 39.0 percent
Earnings per diluted share $3.30 to $3.45
Diluted shares outstanding 213.0
1Includes both our Retail gross profit and the cost of our loyalty program, which is recorded in our Credit segment, as a percentage of net sales.
We plan to open one Nordstrom full-line store and have announced plans to open twelve Nordstrom Rack stores and relocate two Nordstrom Rack
stores during 2012. This will increase our retail square footage by approximately 2.2%.
We expect our gross profit rate to decrease approximately 5 to 35 basis points, after the significant increases in 2011 and 2010. The decrease is
expected as a result of an increasing mix of Nordstrom Rack stores, a reduction in shipping revenue as a result of launching free shipping and free
returns for online purchases in 2011 and expenses related to our enhanced Fashion Rewards program.
The majority of the increase in our Retail SG&A expenses relates to our expectations for increased variable expenses consistent with the planned
increase in sales, additional expenses from stores opened during 2011 and 2012 and accelerated investments in our business to improve the customer
experience both in store and online.
For our Credit segment, we expect credit card revenues to be flat to slightly higher as a result of increased volume, offset by higher payment rates.
We expect Credit SG&A expenses to increase $10 to $20 when compared with 2011 results as no planned reduction in our allowance for credit losses is
expected while 2011 included $30 of reductions.
Interest expense, net is anticipated to increase $25 to $30 due to higher debt levels and a higher average cost of debt.
The guidance above includes the impact of the 53rd week of 2012, which we expect to add approximately $160 to $170 to net sales, and approximately
$0.03 to $0.05 to earnings per diluted share.