Nordstrom 2011 Annual Report Download - page 20
Download and view the complete annual report
Please find page 20 of the 2011 Nordstrom annual report below. You can navigate through the pages in the report by either clicking on the pages listed below, or by using the keyword search tool below to find specific information within the annual report.-
 1
1 -
2
-
3
-
4
-
5
-
6
-
7
-
8
-
9
-
 10
10 -
 11
11 -
 12
12 -
 13
13 -
 14
14 -
 15
15 -
 16
16 -
 17
17 -
 18
18 -
 19
19 -
 20
20 -
 21
21 -
 22
22 -
 23
23 -
 24
24 -
 25
25 -
 26
26 -
 27
27 -
 28
28 -
 29
29 -
 30
30 -
31
-
32
-
33
-
34
-
35
-
36
-
37
-
38
-
39
-
40
-
41
-
42
-
43
-
44
-
45
-
46
-
47
-
48
-
49
-
50
-
51
-
52
-
53
-
54
-
55
-
56
-
57
-
58
-
59
-
60
-
61
-
62
-
63
-
64
-
65
-
66
-
67
-
68
-
69
-
70
-
71
-
72
-
73
-
74
-
75
-
76
-
77
 |
 |

20
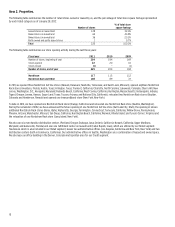
Retail Business
Summary
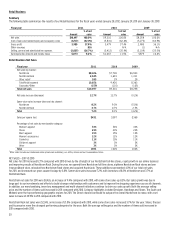
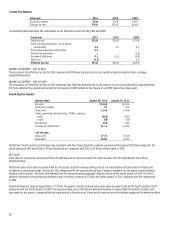
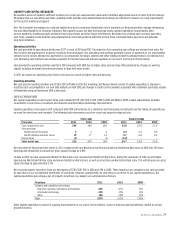
The following table summarizes the results of our Retail Business for the fiscal years ended January 28, 2012, January 29, 2011 and January 30, 2010:
Fiscal year 2011 2010 2009
Amount
% of net
sales
Amount
% of net
sales
Amount
% of net
sales
Net sales $10,497
100.0% $9,310
100.0% $8,258 100.0%
Cost of sales and related buying and occupancy costs (6,517)
(62.1%) (5,831) (62.6%) (5,273) (63.9%)
Gross profit 3,980 37.9% 3,479 37.4% 2,985 36.1%
Other revenues - N/A – N/A (1) N/A
Selling, general and administrative expenses (2,807) (26.7%) (2,412) (25.9%) (2,109) (25.5%)
Earnings before interest and income taxes $1,173 11.2% $1,067 11.5% $875 10.6%
Retail Business Net Sales
Fiscal year 2011 2010 2009
Net sales by channel:
Nordstrom $8,426 $7,700 $6,923
Nordstrom Rack 2,045 1,691 1,411
Other retail1 185 29 29
Total Retail segment 10,656 9,420 8,363
Corporate/Other (159) (110) (105)
Total net sales $10,497 $9,310 $8,258
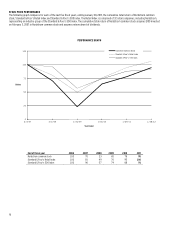
Net sales increase (decrease) 12.7% 12.7% (0.2%)
Same–store sales increase (decrease) by channel:
Nordstrom 8.2% 9.3% (5.0%)
Nordstrom Rack 3.7% 0.7% 2.5%
Total 7.2% 8.1% (4.2%)
Sales per square foot $431 $397 $368
Percentage of net sales by merchandise category:
Women’s apparel 33% 34% 34%
Shoes 23% 23% 22%
Men’s apparel 15% 15% 15%
Women’s accessories 12% 12% 12%
Cosmetics 11% 10% 11%
Children’s apparel 3% 3% 3%
Other 3% 3% 3%
Total 100% 100% 100%
1Other retail includes our HauteLook online private sale subsidiary, our Jeffrey stores and our treasure&bond store.
NET SALES — 2011 VS 2010
Net sales for 2011 increased 12.7% compared with 2010 driven by the strength of our Nordstrom full-line stores, rapid growth in our online business
and improving results at Nordstrom Rack. During the year, we opened three Nordstrom full-line stores, eighteen Nordstrom Rack stores and one
treasure&bond store, relocated two Nordstrom Rack stores and acquired HauteLook. These additions represented 4.0% of our total net sales
for 2011, and increased our gross square footage by 3.8%. Same-store sales increased 7.2%, with increases of 8.2% at Nordstrom and 3.7% at
Nordstrom Rack.
Nordstrom net sales for 2011 were $8,426, an increase of 9.4% compared with 2010, with same-store sales up 8.2%. Our sales growth was due in
large part to our investments and efforts to build stronger relationships with customers and to improve the shopping experience across all channels.
In addition, our merchandising, inventory management and multi-channel initiatives continue to drive our sales growth. Both the average selling
price and the number of items sold increased in 2011 compared with 2010. Category highlights included Designer, Handbags and Shoes. The South and
Midwest were the top-performing geographic regions for 2011. The Direct channel continued to outpace the overall Nordstrom increase, with a net
sales increase of 29.5% in 2011 compared with 2010.
Nordstrom Rack net sales were $2,045, an increase of 21.0% compared with 2010, while same-store sales increased 3.7% for the year. Shoes, Dresses
and Accessories were the strongest performing categories for the year. Both the average selling price and the number of items sold increased in
2011 compared with 2010.