Nordstrom 2011 Annual Report Download - page 26
Download and view the complete annual report
Please find page 26 of the 2011 Nordstrom annual report below. You can navigate through the pages in the report by either clicking on the pages listed below, or by using the keyword search tool below to find specific information within the annual report.-
 1
1 -
2
-
3
-
4
-
5
-
6
-
7
-
8
-
9
-
10
-
11
-
12
-
13
-
14
-
15
-
 16
16 -
 17
17 -
 18
18 -
 19
19 -
 20
20 -
 21
21 -
 22
22 -
 23
23 -
 24
24 -
 25
25 -
 26
26 -
 27
27 -
 28
28 -
 29
29 -
 30
30 -
 31
31 -
 32
32 -
 33
33 -
 34
34 -
 35
35 -
 36
36 -
37
-
38
-
39
-
40
-
41
-
42
-
43
-
44
-
45
-
46
-
47
-
48
-
49
-
50
-
51
-
52
-
53
-
54
-
55
-
56
-
57
-
58
-
59
-
60
-
61
-
62
-
63
-
64
-
65
-
66
-
67
-
68
-
69
-
70
-
71
-
72
-
73
-
74
-
75
-
76
-
77
 |
 |

26
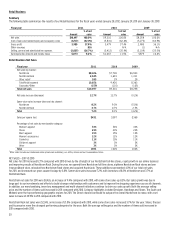
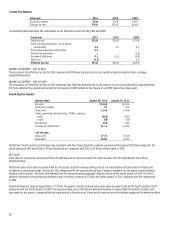
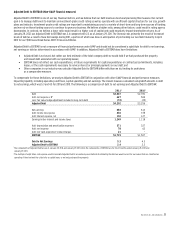
Income Tax Expense
Fiscal year 2011 2010 2009
Income tax expense $436 $378 $255
Effective tax rate 39.0% 38.2% 36.6%
The following table illustrates the components of our effective tax rate for 2011, 2010 and 2009:
Fiscal year 2011 2010 2009
Statutory rate 35.0% 35.0% 35.0%
State and local income taxes, net of federal
income taxes 3.6 3.4 3.5
Non–taxable acquisition–related items 0.6 – –
Deferred tax adjustment – – (1.8)
Permanent differences 0.1 (0.2) (0.6)
Other, net (0.3) – 0.5
Effective tax rate 39.0% 38.2% 36.6%
INCOME TAX EXPENSE — 2011 VS 2010
The increase in the effective tax rate for 2011 compared with 2010 was primarily due to non-taxable acquisition-related items, including
goodwill impairment.
INCOME TAX EXPENSE — 2010 VS 2009
The increase in the effective tax rate for 2010 compared with 2009 was primarily due to the impact of a non-recurring benefit of approximately
$12 from a deferred tax adjustment during the first quarter of 2009 related to the closure of our 2007 federal tax return audit.
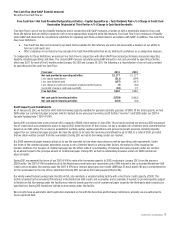
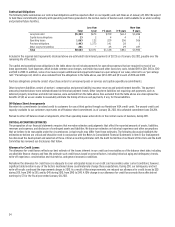
Fourth Quarter Results
Quarter ended January 28, 2012 January 29, 2011
Net sales $3,169
$2,816
Credit card revenues 97 100
Gross profit 1,196 1,058
Selling, general and administrative (“SG&A”) expenses:
Retail (818) (697)
Credit (58) (55)
Net earnings 236 232
Earnings per diluted share $1.11 $1.04
% of net sales:
Gross profit 37.7% 37.6%
Retail SG&A 25.8% 24.8%
Nordstrom’s fourth quarter performance was consistent with the strong trends the company experienced throughout 2011. Net earnings for the
fourth quarter of 2011 were $236, or $1.11 per diluted share, compared with $232, or $1.04 per diluted share, in 2010.
NET SALES
Total sales for the quarter increased 12.5% to $3,169. Same-store sales increased 7.1%, with increases of 8.4% at Nordstrom and 2.2% at
Nordstrom Rack.
Nordstrom same-store sales increased 8.4% for the quarter. Both the average selling price of our merchandise and the number of items sold
increased for the quarter ended January 28, 2012 compared with the same period last year. Category highlights for the quarter were Handbags,
Designer and Cosmetics. The South and Midwest were the top-performing geographic regions relative to the fourth quarter of 2010. The Direct
channel continued to show strong performance, with a net sales increase of 35.1% in the fourth quarter of 2011, compared with the same period
in 2010.
Nordstrom Rack net sales increased $85, or 17.7% for the quarter. Nordstrom Rack same-store sales increased 2.2% for the fourth quarter of 2011
compared with the fourth quarter of 2010. The average selling price of Nordstrom Rack merchandise increased while the number of items sold
decreased for the quarter, compared with the same period in the prior year. Shoes and Accessories were the leading categories for Nordstrom Rack.