Nordstrom 2011 Annual Report Download - page 38
Download and view the complete annual report
Please find page 38 of the 2011 Nordstrom annual report below. You can navigate through the pages in the report by either clicking on the pages listed below, or by using the keyword search tool below to find specific information within the annual report.-
 1
1 -
2
-
3
-
4
-
5
-
6
-
7
-
8
-
9
-
10
-
11
-
12
-
13
-
14
-
15
-
16
-
17
-
18
-
19
-
20
-
21
-
22
-
23
-
24
-
25
-
26
-
27
-
 28
28 -
 29
29 -
 30
30 -
 31
31 -
 32
32 -
 33
33 -
 34
34 -
 35
35 -
 36
36 -
 37
37 -
 38
38 -
 39
39 -
 40
40 -
 41
41 -
 42
42 -
 43
43 -
 44
44 -
 45
45 -
 46
46 -
 47
47 -
 48
48 -
49
-
50
-
51
-
52
-
53
-
54
-
55
-
56
-
57
-
58
-
59
-
60
-
61
-
62
-
63
-
64
-
65
-
66
-
67
-
68
-
69
-
70
-
71
-
72
-
73
-
74
-
75
-
76
-
77
 |
 |

38
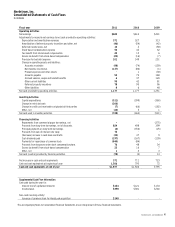
Nordstrom, Inc.
Consolidated Statements of Earnings
In millions except per share amounts
Fiscal year 2011 2010
2009
Net sales $10,497 $9,310 $8,258
Credit card revenues 380 390 369
Total revenues 10,877 9,700 8,627
Cost of sales and related buying and occupancy costs (6,592) (5,897) (5,328)
Selling, general and administrative expenses:
Retail (2,807) (2,412) (2,109)
Credit (229) (273) (356)
Earnings before interest and income taxes 1,249 1,118 834
Interest expense, net (130) (127) (138)
Earnings before income taxes 1,119 991 696
Income tax expense (436) (378) (255)
Net earnings $683 $613 $441
Earnings per share:
Basic $3.20 $2.80 $2.03
Diluted $3.14 $2.75 $2.01
Weighted–average shares outstanding:
Basic 213.5 218.8 216.8
Diluted 217.7 222.6 219.7
The accompanying Notes to Consolidated Financial Statements are an integral part of these financial statements.