Nordstrom 2001 Annual Report Download - page 25
Download and view the complete annual report
Please find page 25 of the 2001 Nordstrom annual report below. You can navigate through the pages in the report by either clicking on the pages listed below, or by using the keyword search tool below to find specific information within the annual report.-
 1
1 -
2
-
3
-
4
-
5
-
6
-
7
-
8
-
9
-
10
-
11
-
12
-
13
-
14
-
 15
15 -
 16
16 -
 17
17 -
 18
18 -
 19
19 -
 20
20 -
 21
21 -
 22
22 -
 23
23 -
 24
24 -
 25
25 -
 26
26 -
 27
27 -
 28
28 -
 29
29 -
 30
30 -
 31
31 -
 32
32 -
 33
33 -
 34
34 -
 35
35 -
36
-
37
-
38
-
39
-
40
-
41
-
42
-
43
-
44
-
45
-
46
-
47
-
48
 |
 |

Blk + 1 pms PAGE 23 pms
550
Cyan Mag Yelo Blk
20200324 NORDSTROM
2001 Annual Report • VERSION
8.375 x 10.875 • SCITEX • 175 lpi • Kodak 80# Cougar
Notes to Consolidated Financial Statements
NORDSTROM INC. AND SUBSIDIARIES 23
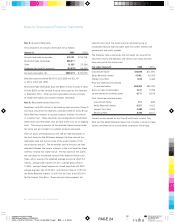
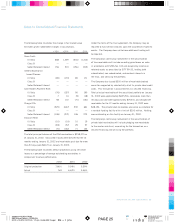
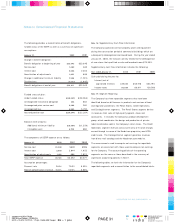
Deferred income taxes reflect the net tax effect of temporary
differences between amounts recorded for financial reporting
purposes and amounts used for tax purposes. The major
components of deferred tax assets and liabilities are as follows:
January 31, 2002 2001
Accrued expenses $33,896 $33,458
Compensation and
benefits accruals 48,584 43,803
Merchandise inventories 24,643 26,290
Capital loss on investment 13,399 12,751
Other 21,12 3 18,298
Total deferred tax assets 141,645 134,600
Land, buildings and
equipment basis and
depreciation differences (49,978) (25,678)
Employee benefits (9,771) (10,937)
Other (3,195) (3,748)
Total deferred tax liabilities (62,944) (40,363)
Net deferred tax assets $78,701 $94,237
As of January 31, 2002, the Company has $34,357 of capital
loss carryforwards available to be utilized within four years to
reduce future capital gain income. No valuation allowance has
been provided because management believes it is more likely
than not that the full benefit of the carryforwards will be realized.
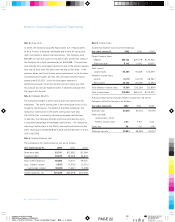
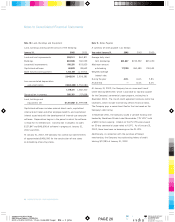
Note 6: Earnings Per Share
Basic earnings per share is computed on the basis of the weighted
average number of common shares outstanding during the year.
Diluted earnings per share is computed on the basis of the
weighted average number of common shares outstanding during
the year plus dilutive common stock equivalents (primarily stock
options, performance share units and restricted stock).
Options with an exercise price greater than the average market
price were not included in the computation of diluted earnings
per share. These options totaled 8,563,996, 7,409,387 and
2,798,966 shares in 2001, 2000 and 1999.
Year ended January 31, 2002 2001 2000
Net earnings $124,688 $101,918 $202,557
Basic shares 134,104,582 131,012,412 137,814,589
Basic earnings per share $0.93 $0.78 $1.47
Dilutive effect of stock options
and restricted stock 234,587 100,673 610,255
Diluted shares 134,339,169 131,113,085 138,424,844
Diluted earnings per share $0.93 $0.78 $1.46
Note 7: Investment
In September 1998, the Company made an investment
in Streamline.com, Inc. (“Streamline”), an Internet grocery
and consumer goods delivery company. Streamline ceased its
operations effective November 22, 2000, due to failure to
obtain additional capital to fund its operations. During 2000,
the Company wrote off its entire investment in Streamline, for
a total pre-tax loss on the investment of $32,857.