Nordstrom 2001 Annual Report Download - page 14
Download and view the complete annual report
Please find page 14 of the 2001 Nordstrom annual report below. You can navigate through the pages in the report by either clicking on the pages listed below, or by using the keyword search tool below to find specific information within the annual report.-
 1
1 -
2
-
3
-
 4
4 -
 5
5 -
 6
6 -
 7
7 -
 8
8 -
 9
9 -
 10
10 -
 11
11 -
 12
12 -
 13
13 -
 14
14 -
 15
15 -
 16
16 -
 17
17 -
 18
18 -
 19
19 -
 20
20 -
 21
21 -
 22
22 -
 23
23 -
 24
24 -
25
-
26
-
27
-
28
-
29
-
30
-
31
-
32
-
33
-
34
-
35
-
36
-
37
-
38
-
39
-
40
-
41
-
42
-
43
-
44
-
45
-
46
-
47
-
48
 |
 |

Blk + 2 pms PAGE 12 pms
8002
pms
550
Cyan Mag Yelo Blk
20200324 NORDSTROM
2001 Annual Report • VERSION
8.375 x 10.875 • SCITEX • 175 lpi • Kodak 80# Cougar
Management’s Discussion and Analysis
12 NORDSTROM INC. AND SUBSIDIARIES
prior year due to lower costs in selling and sales promotion,
partially offset by higher bad debt. The lower selling, general
and administrative costs were the result of a focused effort
to control costs.
LIQUIDITY AND CAPITAL RESOURCES
The Company finances its working capital needs, capital
expenditures, acquisitions, and share repurchase activity with
a combination of cash flows from operations and borrowings.
Management believes that the Company’s operating cash flows,
existing cash and available credit facilities are sufficient to
finance the Company’s operations and planned growth for the
foreseeable future.
Cash Flows from Operations
Net cash provided by operating activities increased approximately
$238 million in 2001 compared to 2000 primarily due to decreases
in merchandise inventories and accounts receivable.
Net cash provided by operating activities decreased approximately
$193 million in 2000 compared to 1999 largely due to lower
net earnings and increases in credit card accounts receivable
and merchandise inventories.
In 2002, cash flows provided by operating activities are expected
to decrease due to increases in accounts receivable related to
increases in credit sales and inventory increases related to the
opening of new stores.
Capital Expenditures
The Company’s capital expenditures aggregated approximately $683
million over the last three years, net of developer reimbursements,
principally to add stores, improve existing facilities and purchase
or develop new information systems. Over 3.5 million square feet
of retail store space was added during this period, representing
an increase of 25% since January 31, 1999.
The Company plans to spend approximately $875 million, net of
developer reimbursements, on capital projects during the next
three years, including new stores, the remodeling of existing
stores, new systems and technology, and other items.
At January 31, 2002, approximately $456 million has been
contractually committed for the construction of new stores
or remodel of existing stores. Although the Company has made
commitments for stores opening in 2002 and beyond, it is possible
that some stores may not be opened as scheduled because of delays
inherent in the development process, or because of the termination
of store site negotiations.
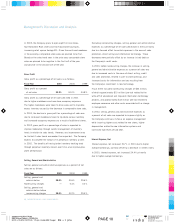
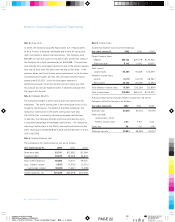
Total Square Footage (thousands)
Share Repurchase
In May 1995, the Board of Directors authorized $1.1 billion of share
repurchases. As of January 31, 2002, the Company has purchased
39 million shares of its common stock for $1 billion, with remaining
share repurchase authority of $82 million. The share repurchase
represents 24% of the shares outstanding as of May 1995 after
adjusting for the 1998 stock split, at an average price per share
of $25.93. Share repurchases have been partially financed through
additional borrowings, resulting in an increase in the Company’s
debt to capital ratio.
Dividend Policy
In 2001, the Company paid $.36 per share of common stock
in cash dividends, the fifth consecutive annual dividend increase.
The Company paid $.35 and $.32 per share of common stock
in fiscal 2000 and 1999.
1997 1998 1999 2000 2001
18,000
16,000
14,000
12,000
10,000
12,614
13,593
14,487
16,056
17,048