Nordstrom 2001 Annual Report Download - page 12
Download and view the complete annual report
Please find page 12 of the 2001 Nordstrom annual report below. You can navigate through the pages in the report by either clicking on the pages listed below, or by using the keyword search tool below to find specific information within the annual report.-
 1
1 -
 2
2 -
 3
3 -
 4
4 -
 5
5 -
 6
6 -
 7
7 -
 8
8 -
 9
9 -
 10
10 -
 11
11 -
 12
12 -
 13
13 -
 14
14 -
 15
15 -
 16
16 -
 17
17 -
 18
18 -
 19
19 -
 20
20 -
 21
21 -
 22
22 -
23
-
24
-
25
-
26
-
27
-
28
-
29
-
30
-
31
-
32
-
33
-
34
-
35
-
36
-
37
-
38
-
39
-
40
-
41
-
42
-
43
-
44
-
45
-
46
-
47
-
48
 |
 |

Blk + 1 pms PAGE 10 pms
550
Cyan Mag Yelo Blk
20200324 NORDSTROM
2001 Annual Report • VERSION
8.375 x 10.875 • SCITEX • 175 lpi • Kodak 80# Cougar
Management’s Discussion and Analysis
10 NORDSTROM INC. AND SUBSIDIARIES
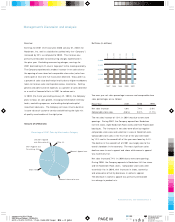
In 2002, the Company plans to open eight full-line stores,
four Nordstrom Rack stores and two Façonnable boutiques,
increasing retail square footage 8%. Given the continued weakness
in the economy, comparable store sales are planned to be flat.
Based on the sales trend seen in the prior year, comparable store
sales are planned to be negative in the first half of the year
and positive in the second half of the year.
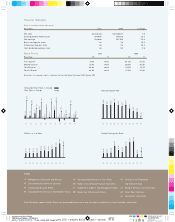
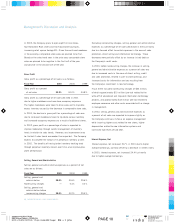
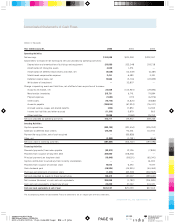
Gross Profit
Gross profit as a percentage of net sales is as follows:
Fiscal Year 2001 2000 1999
Gross profit as a percent
of net sales 33.2% 34.0% 34.8%
Gross profit as a percentage of net sales declined in 2001
due to higher markdowns and new store occupancy expenses.
The higher markdowns were taken to drive sales and to liquidate
excess inventory caused by the decrease in comparable store sales.
In 2000, the decline in gross profit as a percentage of sales was
due to increased markdowns taken to liquidate excess inventory
and increased occupancy expenses as a result of additional stores.
In 2002, gross profit as a percentage of sales is expected to
improve moderately through careful management of inventory
levels in relation to sales trends. However, any improvement may
be limited if sales trends are weaker than expected. The Company
expects to complete the rollout of its perpetual inventory system
in 2002. The benefits of having better inventory tracking tools
through perpetual inventory should, over time, also improve gross
profit performance.
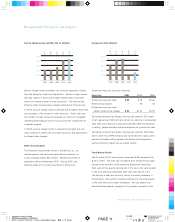
Selling, General and Administrative
Selling, general and administrative expenses as a percent of net
sales are as follows:
Fiscal Year 2001 2000 1999
Selling, general and
administrative 30.6% 31.6% 29.6%
Nonrecurring charges —0.4% 0.2%
Selling, general and
administrative before
nonrecurring charges 30.6% 31.2% 29.4%
Excluding nonrecurring charges, selling, general and administrative
expenses as a percentage of net sales decreased in 2001 primarily
due to a focused effort to control expenses in the areas of sales
promotion, direct selling and information technology. These
decreases were partially offset by an increase in bad debt on
the Company’s credit cards.
In 2000, before nonrecurring charges, the increase in selling,
general and administrative expenses as a percent of sales was
due to increased costs in the areas of direct selling, credit
and sales promotion, related in part to store openings, and
increased costs for information services resulting from
the Company’s investment in new technology.
Fiscal 2000 included nonrecurring charges of $23 million,
of which approximately $10 million (pre-tax) related to the
write-off of abandoned and impaired information technology
projects, and approximately $13 million (pre-tax) related to
employee severance and other costs associated with a change
in management.
In 2002, selling, general and administrative expenses as
a percent of net sales are expected to improve slightly as
the Company continues its focus on expense management
while incurring higher costs related to new stores, higher
depreciation related to new information systems and
continued high levels of bad debt.
Interest Expense, Net
Interest expense, net increased 19.7% in 2001 due to higher
average borrowings, partially offset by a decrease in interest rates.
In 2000, interest expense, net increased 24.4% primarily
due to higher average borrowings.