Nordstrom 2001 Annual Report Download - page 13
Download and view the complete annual report
Please find page 13 of the 2001 Nordstrom annual report below. You can navigate through the pages in the report by either clicking on the pages listed below, or by using the keyword search tool below to find specific information within the annual report.-
 1
1 -
2
-
 3
3 -
 4
4 -
 5
5 -
 6
6 -
 7
7 -
 8
8 -
 9
9 -
 10
10 -
 11
11 -
 12
12 -
 13
13 -
 14
14 -
 15
15 -
 16
16 -
 17
17 -
 18
18 -
 19
19 -
 20
20 -
 21
21 -
 22
22 -
 23
23 -
24
-
25
-
26
-
27
-
28
-
29
-
30
-
31
-
32
-
33
-
34
-
35
-
36
-
37
-
38
-
39
-
40
-
41
-
42
-
43
-
44
-
45
-
46
-
47
-
48
 |
 |
Blk + 2 pms PAGE 11 pms
8002
pms
550
Cyan Mag Yelo Blk
20200324 NORDSTROM
2001 Annual Report • VERSION
8.375 x 10.875 • SCITEX • 175 lpi • Kodak 80# Cougar
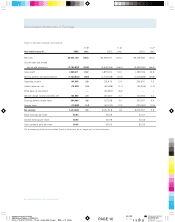
NORDSTROM INC. AND SUBSIDIARIES 11
Management’s Discussion and Analysis
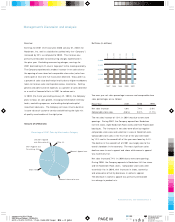
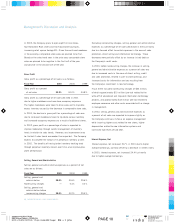
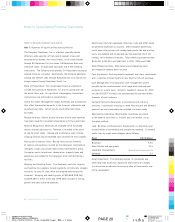
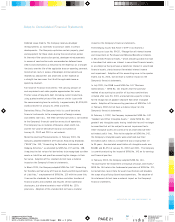
Service Charge Income and Other, Net (in millions)
Service charge income and other, net primarily represents income
from the Company’s credit card operations. Service charge income
declined slightly in 2001 due to lower interest rates, flat credit
sales and a steady number of credit accounts. This decline was
offset by lower miscellaneous charges compared to the prior year.
In 2000, service charge income increased due to higher credit sales
and increases in the number of credit accounts. Credit sales and
the number of credit accounts increased as a result of a targeted
marketing effort toward inactive accounts and the introduction of
a rewards program.
In 2002, service charge income is planned to be higher due to a
small increase in credit sales and credit accounts, and adjustments
to interest rates charged.
Write-off of Investment
The Company held common shares in Streamline, Inc., an
Internet grocery and consumer goods delivery company, at
a cost of approximately $33 million. Streamline ceased its
operations effective November 2000. During 2000, the
Company wrote off its entire investment in Streamline.
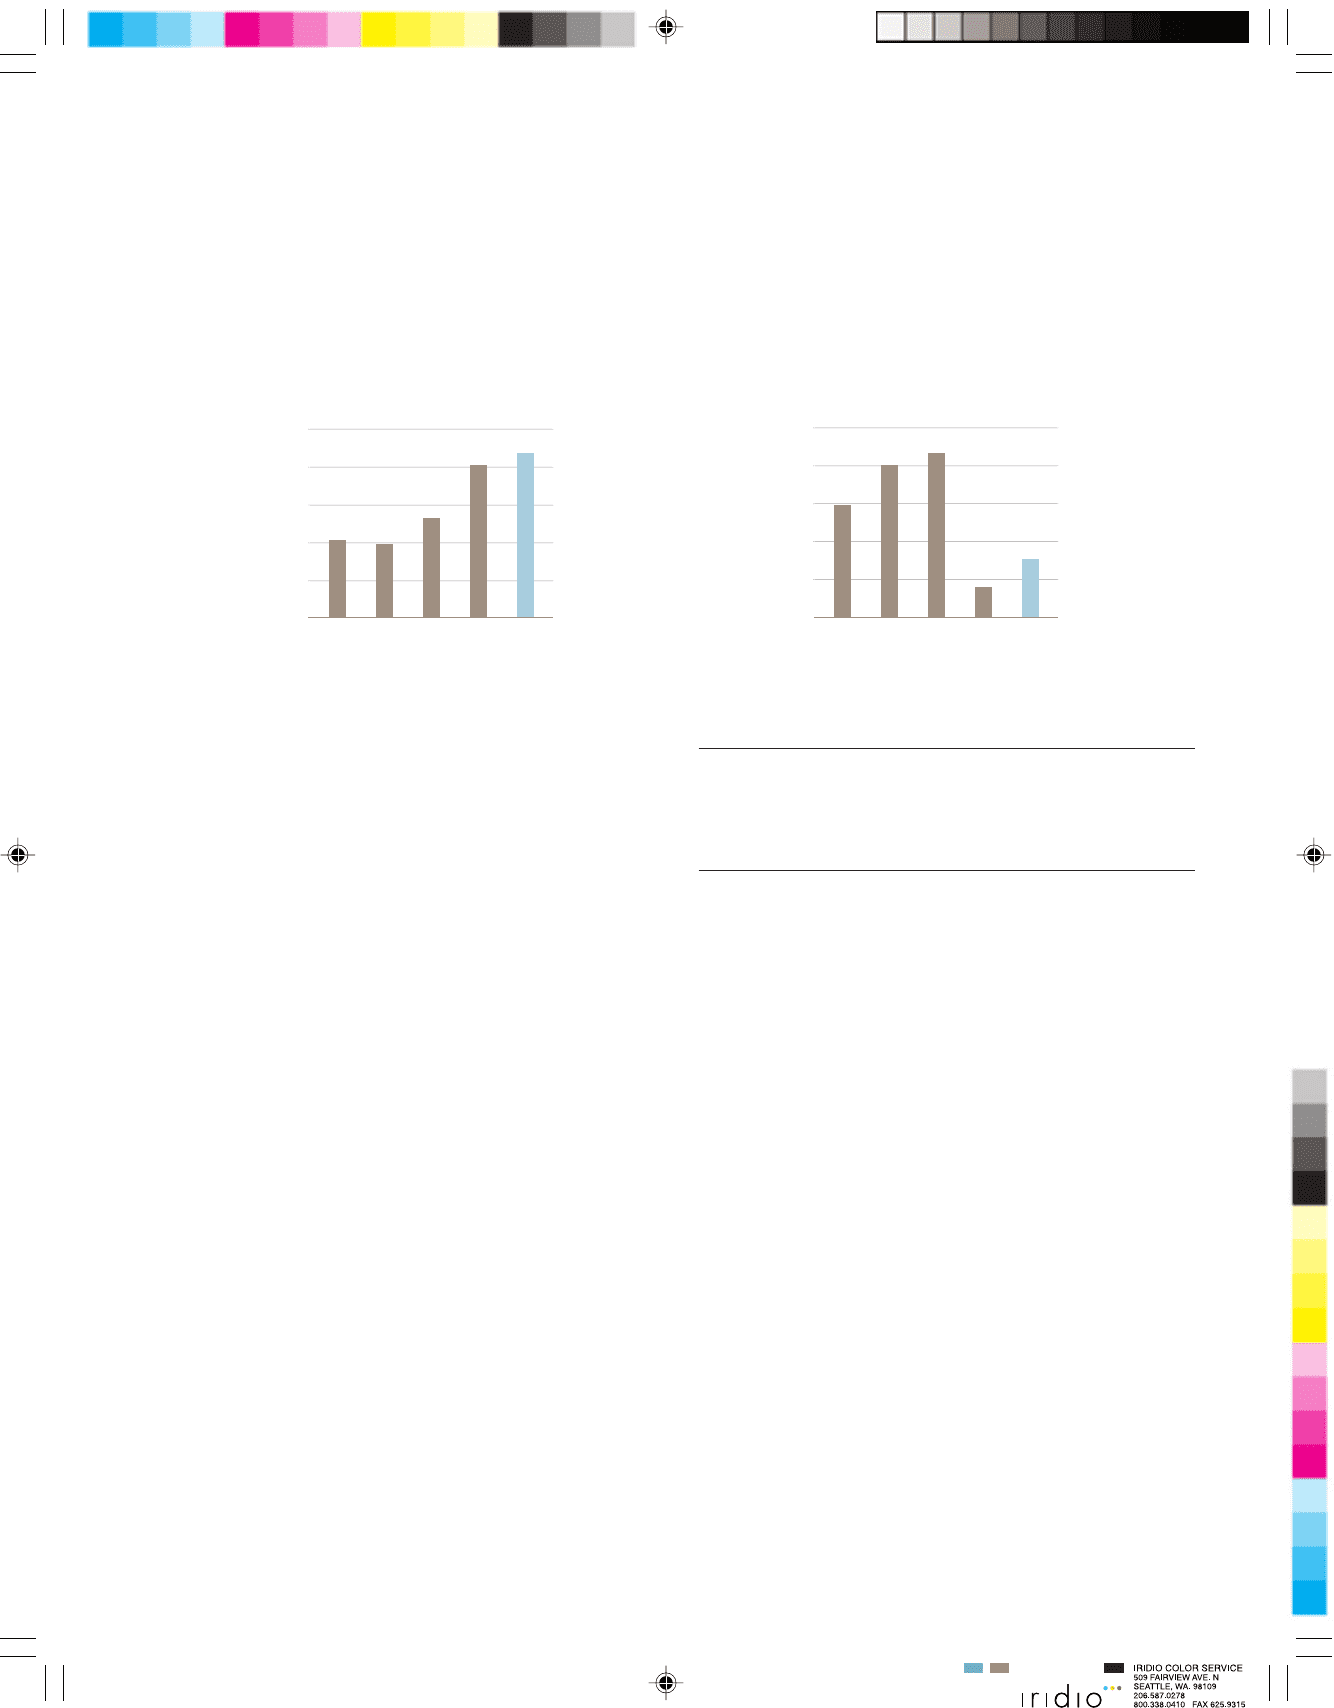
Earnings per Share (Diluted)
Diluted earnings per share are as follows:
Fiscal Year 2001 2000 1999
Diluted earnings per share $.93 $.78 $1.46
Nonrecurring charges —.26 .04
Diluted earnings per share
before nonrecurring charges $.93 $1.04 $1.50
Excluding nonrecurring charges, earnings per share for 2001 were
10.6% worse than 2000 primarily driven by a decline in comparable
store sales and a decline in gross profit percent offset by decreases
in selling, general and administrative expenses as a percent of sales.
Excluding nonrecurring charges, earnings per share for 2000 were
30.7% lower than 1999 primarily due to the decline in gross profit
percent and higher selling, general and administrative expenses,
partially offset by higher service charge income.
Fourth Quarter Results
Fourth quarter 2001 earnings per share were $.38 compared with
$.20 in 2000. The prior year included a $.01 nonrecurring charge
related to the write-off of the remaining Streamline investment.
Total sales for the quarter declined by 1.5% versus the same quarter
in the prior year and comparable store sales declined by 3.4%.
The decline in sales was primarily due to the overall slowdown in
the economy. Gross profit increased compared to the same quarter
in the prior year due to lower markdowns. Selling, general and
administrative expenses improved in the quarter compared to the
1997 1998 1999 2000 2001
$140
$130
$120
$110
$100
$111
$110
$117
$131
$134
1997 1998 1999 2000 2001
$1.60
$1.40
$1.20
$1.00
$0.80
$1.20
$1.41
$1.46
$0.78
$0.93