Nordstrom 2001 Annual Report Download - page 21
Download and view the complete annual report
Please find page 21 of the 2001 Nordstrom annual report below. You can navigate through the pages in the report by either clicking on the pages listed below, or by using the keyword search tool below to find specific information within the annual report.-
 1
1 -
2
-
3
-
4
-
5
-
6
-
7
-
8
-
9
-
10
-
 11
11 -
 12
12 -
 13
13 -
 14
14 -
 15
15 -
 16
16 -
 17
17 -
 18
18 -
 19
19 -
 20
20 -
 21
21 -
 22
22 -
 23
23 -
 24
24 -
 25
25 -
 26
26 -
 27
27 -
 28
28 -
 29
29 -
 30
30 -
 31
31 -
32
-
33
-
34
-
35
-
36
-
37
-
38
-
39
-
40
-
41
-
42
-
43
-
44
-
45
-
46
-
47
-
48
 |
 |

Blk + 2 pms PAGE 19 pms
8002
pms
550
Cyan Mag Yelo Blk
20200324 NORDSTROM
2001 Annual Report • VERSION
8.375 x 10.875 • SCITEX • 175 lpi • Kodak 80# Cougar
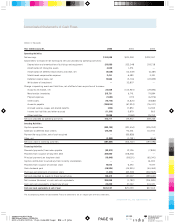
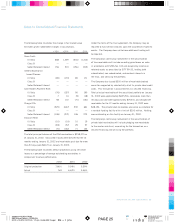
NORDSTROM INC. AND SUBSIDIARIES 19
Consolidated Statements of Cash Flows
Dollars in thousands
Year ended January 31, 2002 2001 2000
Operating Activities
Net earnings $124,688 $101,918 $202,557
Adjustments to reconcile net earnings to net cash provided by operating activities:
Depreciation and amortization of buildings and equipment 213,089 203,048 193,718
Amortization of intangible assets 4,630 1,251 —
Amortization of deferred lease credits and other, net (8,538) (12,349) (6,387)
Stock-based compensation expense 3,414 6,480 3,331
Deferred income taxes, net 15,662 (3,716) (22,859)
Write-down of investment —32,857 —
Change in operating assets and liabilities, net of effects from acquisition of business:
Accounts receivable, net 22,556 (102,945) (29,854)
Merchandise inventories 215,731 6,741 79,894
Prepaid expenses (1,684) (173) (6,976)
Other assets (16,770) (3,821) (8,880)
Accounts payable (159,636) (67,924) (76,417)
Accrued salaries, wages and related benefits (203) 17,850 14,942
Income tax liabilities and other accruals (11,310) 3,879 965
Other liabilities 12,088 (7,184) 25,212
Net cash provided by operating activities 413,717 175,912 369,246
Investing Activities
Capital expenditures (390,138) (321,454) (305,052)
Additions to deferred lease credits 126,383 92,361 114,910
Payment for acquisition, net of cash acquired — (83,828) —
Other, net (3,309) (1,781) (452)
Net cash used in investing activities (267,064) (314,702) (190,594)
Financing Activities
Proceeds (payments) from notes payable (82,912) 12,126 (7,849)
Proceeds from issuance of long-term debt 300,000 308,266 —
Principal payments on long-term debt (18,640) (58,191) (63,341)
Capital contribution to subsidiary from minority shareholders — — 16,000
Proceeds from issuance of common stock 10,542 6,250 9,577
Cash dividends paid (48,265) (45,935) (44,463)
Purchase and retirement of common stock (1,310) (85,509) (302,965)
Net cash provided by (used in) financing activities 159,415 137,007 (393,041)
Net increase (decrease) in cash and cash equivalents 306,068 (1,783) (214,389)
Cash and cash equivalents at beginning of year 25,259 27,042 241,431
Cash and cash equivalents at end of year $331,327 $25,259 $27,042
The accompanying Notes to Consolidated Financial Statements are an integral part of these statements.