Nordstrom 2001 Annual Report Download - page 11
Download and view the complete annual report
Please find page 11 of the 2001 Nordstrom annual report below. You can navigate through the pages in the report by either clicking on the pages listed below, or by using the keyword search tool below to find specific information within the annual report.-
 1
1 -
 2
2 -
 3
3 -
 4
4 -
 5
5 -
 6
6 -
 7
7 -
 8
8 -
 9
9 -
 10
10 -
 11
11 -
 12
12 -
 13
13 -
 14
14 -
 15
15 -
 16
16 -
 17
17 -
 18
18 -
 19
19 -
 20
20 -
 21
21 -
 22
22 -
23
-
24
-
25
-
26
-
27
-
28
-
29
-
30
-
31
-
32
-
33
-
34
-
35
-
36
-
37
-
38
-
39
-
40
-
41
-
42
-
43
-
44
-
45
-
46
-
47
-
48
 |
 |

Blk + 2 pms PAGE 09 pms
8002
pms
550
Cyan Mag Yelo Blk
20200324 NORDSTROM
2001 Annual Report • VERSION
8.375 x 10.875 • SCITEX • 175 lpi • Kodak 80# Cougar
NORDSTROM INC. AND SUBSIDIARIES 9
Management’s Discussion and Analysis
Overview
Earnings for 2001 (the fiscal year ended January 31, 2002) for
Nordstrom, Inc. and its subsidiaries (collectively, the “ Company” )
increased by 22% as compared to 2000. This increase was
primarily attributable to nonrecurring charges experienced in
the prior year. Excluding nonrecurring charges, earnings for
2001 declined by 8.4% due in large part to the slowing economy.
The Company experienced a modest increase in net sales due to
the opening of new stores but comparable store sales (sales from
stores open at least one full fiscal year) declined. Gross profit as
a percent of sales also declined primarily due to higher markdowns
taken to increase sales and liquidate excess inventories. Selling,
general and administrative expenses as a percent of sales declined
as a result of focused efforts in 2001 to reduce costs.
In 2002 (the fiscal year ending January 31, 2003), the Company
plans to focus on sales growth, managing merchandise inventory
levels, controlling expenses, and making disciplined capital
investment decisions. The Company will also strive to build on
its core values of customer service and delivering the right mix
of quality merchandise at the right price.
RESULTS OF OPERATIONS
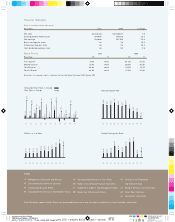
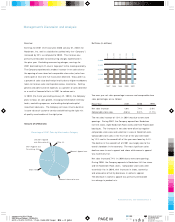
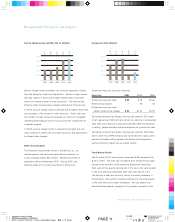
Net Sales (in millions)
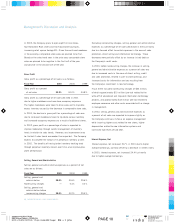
Year over year net sales percentage increases and comparable store
sales percentages are as follows:
Fiscal Year 2 0 01 2000 1999
Net sales increase 1.9 % 7. 4 % 2 . 0 %
Comparable store sales (2 .9 % ) 0.3 % (1.1%)
The net sales increase of 1.9% in 2001 was due to new store
openings. During 2001, the Company opened four Nordstrom
full-line stores, eight Nordstrom Rack stores and three Façonnable
boutiques. The increases in net sales were offset by negative
comparable store sales and a decline in sales at Nordstrom.com.
Comparable store sales in the first half of the year were lower
by 1.3% and in the second half of the year were lower by 4.4%.
The decline in the second half of 2001 was largely due to the
overall slowdown in the economy. The most significant sales
declines were in men’s apparel and shoes while women’s apparel
was essentially f lat.
Net sales increased 7.4% in 2000 due to new store openings.
During 2000, the Company opened six Nordstrom full-line stores
and ten Nordstrom Rack stores. Comparable store sales were
essentially flat in 2000, with increases in shoes, cosmetics
and accessories of fset by decreases in women’s apparel.
The decrease in women’s apparel was primarily attributable
to a change in product mix.
Percentage of 2001 Sales by Merchandise Category
Women’s Accessories 21%
Shoes 1 9 %
Men’s Apparel and
Furnishings 1 8 %
Children’s Apparel
and Accessories 4 %
Women’s Apparel 3 5 %
Other 3 %
1997 1998 1999 2000 2001
$6,000
$5,500
$5,000
$4,500
$4,000
$ 4 ,8 6 5
$ 5 ,0 4 9
$ 5 ,14 9
$ 5 ,5 2 9
$ 5 ,6 3 4