Nordstrom 2001 Annual Report Download - page 2
Download and view the complete annual report
Please find page 2 of the 2001 Nordstrom annual report below. You can navigate through the pages in the report by either clicking on the pages listed below, or by using the keyword search tool below to find specific information within the annual report.-
 1
1 -
 2
2 -
 3
3 -
 4
4 -
 5
5 -
 6
6 -
 7
7 -
 8
8 -
 9
9 -
 10
10 -
 11
11 -
 12
12 -
 13
13 -
14
-
15
-
16
-
17
-
18
-
19
-
20
-
21
-
22
-
23
-
24
-
25
-
26
-
27
-
28
-
29
-
30
-
31
-
32
-
33
-
34
-
35
-
36
-
37
-
38
-
39
-
40
-
41
-
42
-
43
-
44
-
45
-
46
-
47
-
48
 |
 |

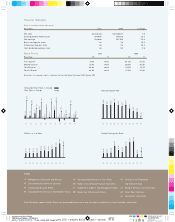
1NORDSTROM INC. AND SUBSIDIARIES
Financial Highlights
Dollars in thousands except per share amounts
Fiscal Year 2 001 2000 % Change
Net sales $5,634,130 $5,528,537 1.9
Earnings before income taxes 2 0 4 ,4 8 8 16 7,018 2 2 .4
Net earnings 12 4 , 6 8 8 101,918 22.3
Basic earnings per share .9 3 .78 19.2
Diluted earnings per share .9 3 .78 19.2
Cash dividends paid per share .3 6 .35 2.9
Stock Prices 2 0 01 2000
Fiscal Year high low high low
First Quarter 21.17 15 . 6 0 34.50 18.25
Second Quarter 2 2 .75 17 .0 0 30.00 16.56
Third Quarter 2 2 .9 7 13 . 8 0 19.50 14.19
Fourth Quarter 2 5 .5 0 14 .2 5 21.0 0 14 .8 8
Nordstrom, Inc. common stock is traded on the New York Stock Exchange NYSE Symbol JWN
View this entire report online. Please visit www.nordstrom.com to see this report and obtain the latest available information.
Sales per Square Foot
Index
9Management’s Discussion and Analysis
16 Consolidated Statements of Earnings
17 Consolidated Balance Sheets
18 Consolidated Statements of Shareholders’ Equity
40 Of ficers of the Corporation
and Executive Team
41 Board of Directors and Committees
42 Retail Store Facilities
44 Shareholder Information
91 92 93 94 95 96 97 98 99 00 0 1
•
••
•
•
•
•
•
•
•
•
$388
$381
$383
$395
$382
$377
$384
$362
$350
$342
$ 3 21
19 Consolidated Statements of Cash Flows
20 Notes to Consolidated Financial Statements
37 Independent Auditors’ and Management Report
38 Eleven-Year Statistical Summary
Diluted Earnings per Share
91 92 93 94 95 96 97 98 99 00 0 1
•
•
•
•
•
•
•
•
•
•
•
$0.82
$0.82
$0.86
$1.23
$1.00
$0.90
$1.20
$1.41
$1.46
$0.78
$ 0 .9 3
SG&A as a % of Sales
91 92 93 94 95 96 97 98 99 00 0 1
•
•
•
•
•
•
•
•
•
•
•
26.2%
26.4%
26.2%
26.4%
27.6%
27.7%
27.5%
28.3%
29.6%
31.6%
3 0 .6 %
Comparable Store Sales % Change
Total Sales % Change
91 92 93 94 95 96 97 98 99 00 0 1
•
•
1.4% 9.8%
•
•
1.4% 7.6%
•
•
2.7% 5.1%
•
•
••
4.4% 8.5%
•
•
-0.7% 5.6%
•
•
0.6% 8.4%
•
•
4.0% 9.1%
•
•
-2.7% 3.8%
•
•
-1.1 % 2.0%
•
•
0.3% 7.4%
•
•
- 2. 9 %
1. 9 %
IFC pms
8002
Cyan Mag Yelo Blk
20200324 NORDSTROM
2001 Annual Report • VERSION
8.375 x 10.875 • SCITEX • 175 lpi • Kodak 80# Cougar pms 550 + metalic 8002 + black + varnish