Nissan 2009 Annual Report Download - page 84
Download and view the complete annual report
Please find page 84 of the 2009 Nissan annual report below. You can navigate through the pages in the report by either clicking on the pages listed below, or by using the keyword search tool below to find specific information within the annual report.-
 1
1 -
2
-
3
-
4
-
5
-
6
-
7
-
8
-
9
-
10
-
11
-
12
-
13
-
14
-
15
-
16
-
17
-
18
-
19
-
20
-
21
-
22
-
23
-
24
-
25
-
26
-
27
-
28
-
29
-
30
-
31
-
32
-
33
-
34
-
35
-
36
-
37
-
38
-
39
-
40
-
41
-
42
-
43
-
44
-
45
-
46
-
47
-
48
-
49
-
50
-
51
-
52
-
53
-
54
-
55
-
56
-
57
-
58
-
59
-
60
-
61
-
62
-
63
-
64
-
65
-
66
-
67
-
68
-
69
-
70
-
71
-
72
-
73
-
 74
74 -
 75
75 -
 76
76 -
 77
77 -
 78
78 -
 79
79 -
 80
80 -
 81
81 -
 82
82 -
 83
83 -
 84
84 -
 85
85 -
 86
86 -
 87
87
 |
 |
82 Nissan Annual Report 2009
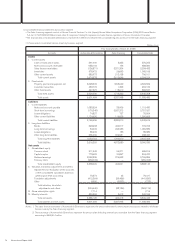
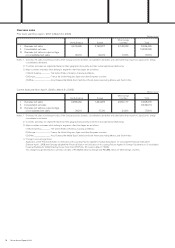
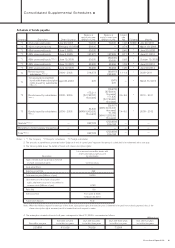
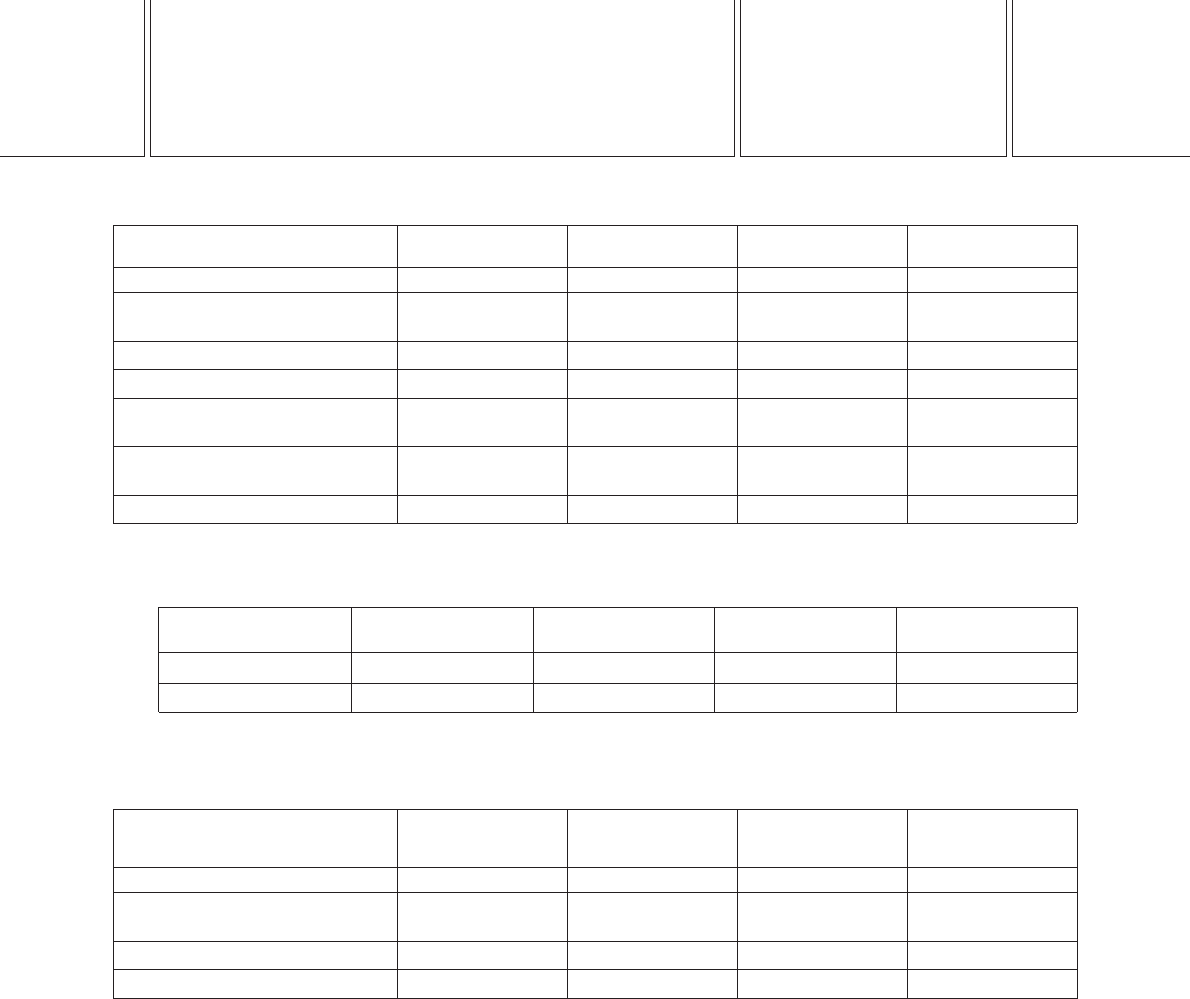
Balance at Balance at Average interest
Category end of prior year end of current year rate (%) Maturity
Short-term borrowings 988,342 660,956 2.28 —
Current portion of long-term
borrowings 666,844 770,494 2.73 —
Commercial paper 951,843 639,152 1.41 —
Current portion of lease obligations 75,554 71,379 2.75 —
Long-term borrowings 1,050,889 1,700,015 2.49 April 2010 to
(excluding current portion) October 2027
Lease obligations 85,389 105,539 3.08 April 2010 to
(excluding current portion) March 2021
Total 3,818,861 3,947,535 — —
Notes: 1. The average interest rate represents the weighted-average rate applicable to the year-end balance.
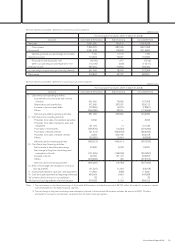
2. The following table shows the aggregate annual maturities of long-term borrowings (excluding the current portion) and lease obligations (excluding the
current portion) for 5 years subsequent to March 31, 2009.
(Millions of yen)
Due after one year Due after two years Due after three years Due after four years
but within two years but within three years but within four years but within five years
Long-term borrowings 473,805 746,528 186,399 264,614
Lease obligations 38,416 21,273 20,185 14,171
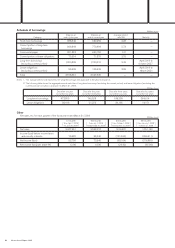
Other
Net sales, etc. for each quarter of the fiscal year ended March 31, 2009
Schedule of borrowings (Millions of yen)
1st Quarter 2nd Quarter 3rd Quarter 4th Quarter
From April 1, 2008 From July 1, 2008 From October 1, 2008 From January 1, 2009
[
To June 30, 2008
][
To September 30, 2008
][
To December 31, 2008
][
To March 31, 2009
]
Net sales 2,347,251 2,522,074 1,816,497 1,751,152
Income (loss) before income taxes
and minority interests 75,285 94,045 (121,590) (266,511)
Net income (loss) 52,798 73,546 (83,164) (276,889)
Net income (loss) per share (¥) 12.96 18.06 (20.42) (67.98)
(Millions of yen)