Nissan 2009 Annual Report Download - page 27
Download and view the complete annual report
Please find page 27 of the 2009 Nissan annual report below. You can navigate through the pages in the report by either clicking on the pages listed below, or by using the keyword search tool below to find specific information within the annual report.-
 1
1 -
2
-
3
-
4
-
5
-
6
-
7
-
8
-
9
-
10
-
11
-
12
-
13
-
14
-
15
-
16
-
 17
17 -
 18
18 -
 19
19 -
 20
20 -
 21
21 -
 22
22 -
 23
23 -
 24
24 -
 25
25 -
 26
26 -
 27
27 -
 28
28 -
 29
29 -
 30
30 -
 31
31 -
 32
32 -
 33
33 -
 34
34 -
 35
35 -
 36
36 -
 37
37 -
38
-
39
-
40
-
41
-
42
-
43
-
44
-
45
-
46
-
47
-
48
-
49
-
50
-
51
-
52
-
53
-
54
-
55
-
56
-
57
-
58
-
59
-
60
-
61
-
62
-
63
-
64
-
65
-
66
-
67
-
68
-
69
-
70
-
71
-
72
-
73
-
74
-
75
-
76
-
77
-
78
-
79
-
80
-
81
-
82
-
83
-
84
-
85
-
86
-
87
 |
 |

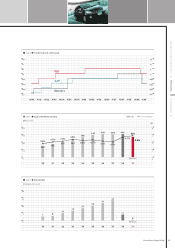
Aa3
A1
A2
A3
Baa1
Baa2
Baa3
Ba1
600
0
450
300
150
(Billions of yen)
60
0
45
30
15
(Dividend per share, in yen)
AA–
A+
A
A–
BBB+
BBB
BBB–
BB+
8
0
6
4
2
(%)
(Forecast)
(Forecast)
10/04 4/05 10/05 4/0610/02 4/03 10/03 4/0410/01 4/02 10/06 4/07 10/07 4/08 10/08 4/09
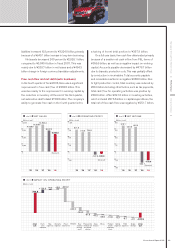
R&D % of net revenue
398
456
448 465 458
232 262 300 354
3.8% 4.2% 4.4% 4.8%
4.6% 4.7% 4.4% 4.2%
5.4%
400
5.8%
Moody’s
S&P
R&I
chart 09
<
<
CORPORATE RATINGS
chart 10
<
<
R&D EXPENDITURES
chart 11
<
<
DIVIDEND
24
29
34
40
78
14
19
11
0
,00 ,01 ,02 ,03 ,04 ,05 ,06 ,07 ,08 ,09
,00 ,01 ,02 ,03 ,04 ,05 ,06 ,07 ,08 ,09
<
<
<
Nissan Annual Report 2009 25
Managing Through the Global Crisis Performance Corporate Data