Nissan 2009 Annual Report Download - page 82
Download and view the complete annual report
Please find page 82 of the 2009 Nissan annual report below. You can navigate through the pages in the report by either clicking on the pages listed below, or by using the keyword search tool below to find specific information within the annual report.-
 1
1 -
2
-
3
-
4
-
5
-
6
-
7
-
8
-
9
-
10
-
11
-
12
-
13
-
14
-
15
-
16
-
17
-
18
-
19
-
20
-
21
-
22
-
23
-
24
-
25
-
26
-
27
-
28
-
29
-
30
-
31
-
32
-
33
-
34
-
35
-
36
-
37
-
38
-
39
-
40
-
41
-
42
-
43
-
44
-
45
-
46
-
47
-
48
-
49
-
50
-
51
-
52
-
53
-
54
-
55
-
56
-
57
-
58
-
59
-
60
-
61
-
62
-
63
-
64
-
65
-
66
-
67
-
68
-
69
-
70
-
71
-
 72
72 -
 73
73 -
 74
74 -
 75
75 -
 76
76 -
 77
77 -
 78
78 -
 79
79 -
 80
80 -
 81
81 -
 82
82 -
 83
83 -
 84
84 -
 85
85 -
 86
86 -
 87
87
 |
 |

Prior fiscal year Current fiscal year
From April 1, 2007 From April 1, 2008
[
To March 31, 2008
][
To March 31, 2009
]
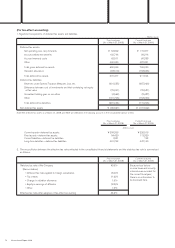
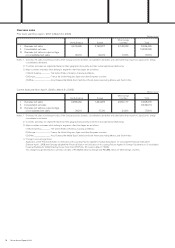
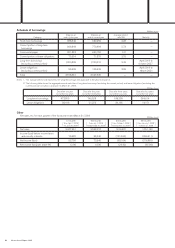
Net assets per share ¥860.17 Net assets per share ¥644.60
Basic net income per share ¥117.76 Basic net loss per share (¥57.38)
Diluted net income per share ¥117.56 Diluted net income per share —
Notes:
1. The information on “Diluted net income per share” for the current fiscal year is not provided because we recorded a net loss for the current fiscal year,
although we do have potential dilutive stock.
2. The basis for calculation of the net assets per share is as follows.
Prior fiscal year Current fiscal year
(As of March 31, 2008) (As of March 31, 2009)
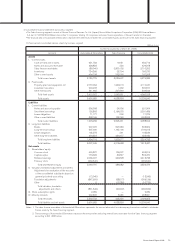
Total net assets (Millions of yen) 3,849,443 2,926,053
Amounts deducted from total net assets (Millions of yen) 344,479 300,420
(Share subscription rights) 1,714 2,089
(Minority interests) 342,765 298,331
Net assets attributable to shares of common stock at year end
(Millions of yen) 3,504,964 2,625,633
The year-end number of common stock used for the calculation
of net assets per share (Thousands)4,074,721 4,073,303
(Amounts per share)
80 Nissan Annual Report 2009
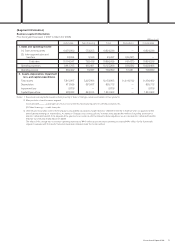
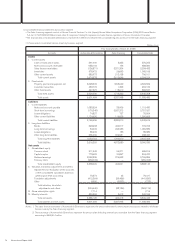
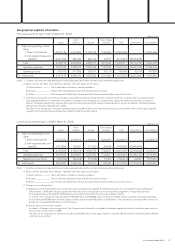
3. The basis for calculation of the basic net income (loss) per share and the diluted net income per share is as follows.
Prior fiscal year Current fiscal year
From April 1, 2007 From April 1, 2008
[
To March 31, 2008
][
To March 31, 2009
]
Basic net income (loss) per share:
Net income (loss) (Millions of yen) 482,261 (233,709)
Net income (loss) attributable to shares of
common stock (Millions of yen) 482,261 (233,709)
Average number of shares of common
stock during the fiscal year (Thousands) 4,095,407 4,073,234
Diluted net income per share:
Increase in shares of common stock (Thousands) 6,921 —
(Exercise of warrants) 5,228 —
(Exercise of share subscription rights) 1,693 —
2nd share subscription rights
(the number of share subscription
rights is 91,889 units)
4th share subscription rights
(the number of share subscription
rights is 79,368 units)
5th share subscription rights
(the number of share subscription
rights is 6,800 units)
6th share subscription rights
(the number of share subscription
rights is 3,600 units)
Refer to “Status of share subscription
rights” for a summary.
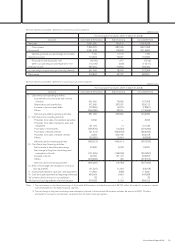
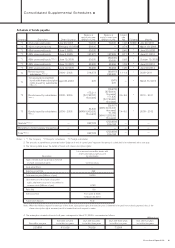
Securities excluded from the computation of
diluted net income per share, because they
do not have dilutive effects.
1st share subscription rights
(the number of share subscription
rights is 65,091 units)
2nd share subscription rights
(the number of share subscription
rights is 91,599 units)
3rd share subscription rights
(the number of share subscription
rights is 80,565 units)
4th share subscription rights
(the number of share subscription
rights is 78,768 units)
5th share subscription rights
(the number of share subscription
rights is 6,500 units)
6th share subscription rights
(the number of share subscription
rights is 3,600 units)
7th share subscription rights
(the number of share subscription
rights is 35,900 units) etc.
Refer to “Status of share subscription
rights” for a summary.
(Significant subsequent events)
Not applicable