Nissan 2009 Annual Report Download - page 25
Download and view the complete annual report
Please find page 25 of the 2009 Nissan annual report below. You can navigate through the pages in the report by either clicking on the pages listed below, or by using the keyword search tool below to find specific information within the annual report.-
 1
1 -
2
-
3
-
4
-
5
-
6
-
7
-
8
-
9
-
10
-
11
-
12
-
13
-
14
-
 15
15 -
 16
16 -
 17
17 -
 18
18 -
 19
19 -
 20
20 -
 21
21 -
 22
22 -
 23
23 -
 24
24 -
 25
25 -
 26
26 -
 27
27 -
 28
28 -
 29
29 -
 30
30 -
 31
31 -
 32
32 -
 33
33 -
 34
34 -
 35
35 -
36
-
37
-
38
-
39
-
40
-
41
-
42
-
43
-
44
-
45
-
46
-
47
-
48
-
49
-
50
-
51
-
52
-
53
-
54
-
55
-
56
-
57
-
58
-
59
-
60
-
61
-
62
-
63
-
64
-
65
-
66
-
67
-
68
-
69
-
70
-
71
-
72
-
73
-
74
-
75
-
76
-
77
-
78
-
79
-
80
-
81
-
82
-
83
-
84
-
85
-
86
-
87
 |
 |

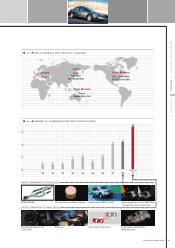
chart 08
<
<
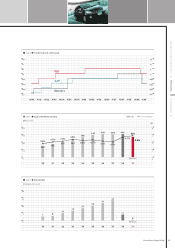
IMPACT ON OPERATING PROFIT
chart 06
<
<
OPERATING PROFIT
<
chart 05
<
<
NET SALES
<
chart 07
<
<
NET INCOME
<
(Forecast)
(Forecast)
(Forecast)
<
10,824.2
8,437.0
6,950.0
9,428.3
10,468.6
(Billions of yen)
-134.2 -91.8 -40.2 -26.6 -13.8
+134.6 +8.2 -525.2
-223.0
790.8
-137.9
+5.6
-9.3 -8.7 -4.3
,05 ,06 ,07 ,08 ,09 ,05 ,06 ,07 ,08 ,09 ,05 ,06 ,07 ,08 ,09
-150
-300
1,200
0
900
600
300
-300
(Billions of yen)(Billions of yen)(Billions of yen)
600
0
450
300
150
482.3
-233.7
-170.0
790.8
-137.9 -100.0
871.8
776.9
12,000
0
9,000
6,000
3,000
518.1
460.8
FOREX Raw
material
/energy
costs
Provision for
residual risk
on leased
vehicles
Sales
finance
Purch.
cost
reduction
Mfg.
expenses
Warranty
expenses
Price/
volume mix
FY07
O.P.
Others Product
enrich./
regulatory
costs
Scope
change
R&D
expenses
Selling
expenses
FY08
O.P.
liabilities increased16.8 percent to ¥3,324.8 billion, primarily
because of a ¥649.1 billion increase in long-term borrowing.
Net assets decreased 24.0 percent to ¥2,926.1 billion,
compared to ¥3,849.4 billion in fiscal 2007. This was
mainly due to ¥233.7 billion in net losses and a ¥464.3
billion change in foreign currency translation adjustments.
Free cash flow and net debt (auto business)
In the fourth quarter of fiscal 2008,there was a significant
improvement in free cash flow of ¥363.5 billion. This
was due mainly to the improvement in working capital by
the reduction
in inventory. At the end of the third quarter,
net automotive
debt totaled ¥783.5 billion.The company’s
ability to generate free cash in the fourth quarter led to
a halving of its net debt position to ¥387.9 billion.
On a full-year basis, free cash flow deteriorated primarily
because of
a smaller net cash inflow from P&L items of
¥356.6 billion, as well as a negative impact on working
capital. Accounts payable decreased by ¥479.7 billion
due to dramatic production cuts. This was partially offset
by a reduction in receivables. Total accounts payable
and receivable resulted in a negative ¥286.2 billion. Due
to tight production control, total inventory was reduced by
¥88.3 billion. Including other factors, such as tax payments,
total cash flow for operating activities was positive by
¥39.9 billion. After ¥291.6 billion in investing activities,
which included ¥376.6 billion in capital expenditures, the
total net of free cash flow was negative by ¥251.7 billion.
Nissan Annual Report 2009 23
Managing Through the Global Crisis Performance Corporate Data