Nissan 2009 Annual Report Download - page 12
Download and view the complete annual report
Please find page 12 of the 2009 Nissan annual report below. You can navigate through the pages in the report by either clicking on the pages listed below, or by using the keyword search tool below to find specific information within the annual report.-
 1
1 -
 2
2 -
 3
3 -
 4
4 -
 5
5 -
 6
6 -
 7
7 -
 8
8 -
 9
9 -
 10
10 -
 11
11 -
 12
12 -
 13
13 -
 14
14 -
 15
15 -
 16
16 -
 17
17 -
 18
18 -
 19
19 -
 20
20 -
 21
21 -
 22
22 -
23
-
24
-
25
-
26
-
27
-
28
-
29
-
30
-
31
-
32
-
33
-
34
-
35
-
36
-
37
-
38
-
39
-
40
-
41
-
42
-
43
-
44
-
45
-
46
-
47
-
48
-
49
-
50
-
51
-
52
-
53
-
54
-
55
-
56
-
57
-
58
-
59
-
60
-
61
-
62
-
63
-
64
-
65
-
66
-
67
-
68
-
69
-
70
-
71
-
72
-
73
-
74
-
75
-
76
-
77
-
78
-
79
-
80
-
81
-
82
-
83
-
84
-
85
-
86
-
87
 |
 |

Message from the CFO >
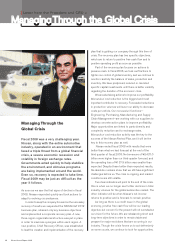
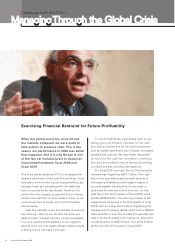
When the global economic crisis hit and
the markets collapsed, we were quick to
take actions to preserve cash. This is the
reason our performance in 2008 was better
than expected. And it is why Nissan is one
of the few car manufacturers to expect an
improvement between fiscal 2008 and
fiscal 2009.
One of my primary tasks as CFO is to emphasize the
idea and importance of free cash flow at Nissan. As an
automaker, we know about producing and selling cars,
and about cash and operating profit—the latter has
been our priority for the last decade. However, in a
period when the company is expected to incur losses,
positive free cash flow is not an intuitive notion, so we
continuously have to explain why it is both feasible
and necessary.
Cash flow naturally comes from the sale of products
and reducing costs, but you can also discipline your
balance sheet—manage inventory, control receivables
from your customers and payables to your suppliers
and sell some non-core assets. Nissan’s balance sheet
is strong, but we can make it stronger.
To ensure that Nissan is generating cash, we are
setting up key performance indicators on free cash
flow, both as a whole and for individual components
such as capital expenditures, sale of assets, receivables,
payables and inventory. We have teams responsible
for each. Our free cash flow committee is monitoring
their activities monthly to ensure that we are meeting
our objectives and correcting discrepancies.
For fiscal 2008, free cash flow for the automotive
business was negative by ¥251.7 billion. Free cash
flow for the year deteriorated primarily because of
decreased profitability and the negative impact on
accounts payable resulting from the decrease in
production for inventory control. However, our free
cash flow in the fourth quarter of fiscal 2008 was a
positive ¥363.5 billion. This was due primarily to the
measures we introduced in the third quarter of fiscal
2008, such as cutting fixed costs and tightening the
management of working capital, which led to a ¥354.5
billion reduction in inventory. Our ability to generate free
cash in the fourth quarter led to halving our automotive
net debt position to ¥387.9 billion from ¥783.5 billion
at the end of the third quarter in fiscal 2008.
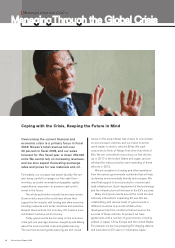
Exercising Financial Restraint for Future Profitability
10 Nissan Annual Report 2009