Nissan 2009 Annual Report Download - page 74
Download and view the complete annual report
Please find page 74 of the 2009 Nissan annual report below. You can navigate through the pages in the report by either clicking on the pages listed below, or by using the keyword search tool below to find specific information within the annual report.-
 1
1 -
2
-
3
-
4
-
5
-
6
-
7
-
8
-
9
-
10
-
11
-
12
-
13
-
14
-
15
-
16
-
17
-
18
-
19
-
20
-
21
-
22
-
23
-
24
-
25
-
26
-
27
-
28
-
29
-
30
-
31
-
32
-
33
-
34
-
35
-
36
-
37
-
38
-
39
-
40
-
41
-
42
-
43
-
44
-
45
-
46
-
47
-
48
-
49
-
50
-
51
-
52
-
53
-
54
-
55
-
56
-
57
-
58
-
59
-
60
-
61
-
62
-
63
-
 64
64 -
 65
65 -
 66
66 -
 67
67 -
 68
68 -
 69
69 -
 70
70 -
 71
71 -
 72
72 -
 73
73 -
 74
74 -
 75
75 -
 76
76 -
 77
77 -
 78
78 -
 79
79 -
 80
80 -
 81
81 -
 82
82 -
 83
83 -
 84
84 -
85
-
86
-
87
 |
 |

72 Nissan Annual Report 2009
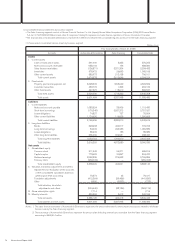
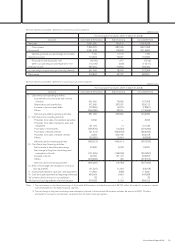
4. Consolidated financial statements by business segment
• The Sales financing segment consists of Nissan Financial Services Co., Ltd. (Japan), Nissan Motor Acceptance Corporation (USA), NR Finance Mexico
S.A. de C.V. SOFOM E.N.R (Mexico) and other 5 companies, totaling 8 companies, and sales finance operations of Nissan Canada Inc. (Canada).
•The financial data on Automobile & Eliminations represent the differences between the consolidated figures and those for the Sales financing segment.
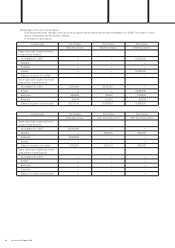
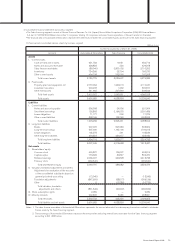
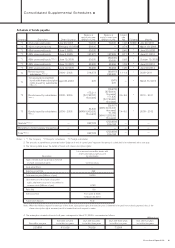
(1) Summarized consolidated balance sheets by business segment
(Millions of yen)
Prior fiscal year (As of March 31, 2008)
Accounts Automobile & Eliminations Sales financing Consolidated total
Assets
I. Current assets
Cash on hand and in banks 561,900 8,325 570,225
Notes and accounts receivable 688,104 196 688,300
Sales finance receivables (136,871) 3,371,304 3,234,433
Inventories 978,472 26,693 1,005,165
Other current assets 582,973 213,128 796,101
Total current assets 2,674,578 3,619,646 6,294,224
II. Fixed assets
Property, plant and equipment, net 3,028,503 1,598,049 4,626,552
Investment securities 450,776 1,393 452,169
Other fixed assets 447,627 118,910 566,537
Total fixed assets 3,926,906 1,718,352 5,645,258
Total assets 6,601,484 5,337,998 11,939,482
Liabilities
I. Current liabilities
Notes and accounts payable 1,083,524 35,906 1,119,430
Short-term borrowings (170,345) 2,927,372 2,757,027
Lease obligations 74,827 727 75,554
Other current liabilities 1,174,600 116,005 1,290,605
Total current liabilities 2,162,606 3,080,010 5,242,616
II. Long-term liabilities
Bonds 348,208 424,517 772,725
Long-term borrowings 54,903 995,986 1,050,889
Lease obligations 85,203 186 85,389
Other long-term liabilities 565,439 372,981 938,420
Total long-term liabilities 1,053,753 1,793,670 2,847,423
Total liabilities 3,216,359 4,873,680 8,090,039
Net assets
I. Shareholders’ equity
Common stock 511,543 94,271 605,814
Capital surplus 773,623 30,847 804,470
Retained earnings 2,352,336 374,523 2,726,859
Treasury stock (269,003) — (269,003)
Total shareholders’ equity 3,368,499 499,641 3,868,140
II. Valuation, translation adjustments and others
Adjustments for revaluation of the accounts
of the consolidated subsidiaries based on
general price level accounting 79,374 43 79,417
Translation adjustments (412,364) (29,456) (441,820)
Other 8,550 (9,323) (773)
Total valuation, translation
adjustments and others (324,440) (38,736) (363,176)
III. Share subscription rights 1,714 — 1,714
IV. Minority interests 339,352 3,413 342,765
Total net assets 3,385,125 464,318 3,849,443
Total liabilities and net assets 6,601,484 5,337,998 11,939,482
Notes: 1. The sales finance receivables of Automobile & Eliminations represents the amount eliminated for intercompany transactions related to wholesale
finance made by the Sales financing segment.
2. The borrowings of Automobile & Eliminations represent the amount after deducting internal loans receivable from the Sales financing segment
amounting to ¥900,614 million.