Nissan 2009 Annual Report Download - page 21
Download and view the complete annual report
Please find page 21 of the 2009 Nissan annual report below. You can navigate through the pages in the report by either clicking on the pages listed below, or by using the keyword search tool below to find specific information within the annual report.-
 1
1 -
2
-
3
-
4
-
5
-
6
-
7
-
8
-
9
-
10
-
 11
11 -
 12
12 -
 13
13 -
 14
14 -
 15
15 -
 16
16 -
 17
17 -
 18
18 -
 19
19 -
 20
20 -
 21
21 -
 22
22 -
 23
23 -
 24
24 -
 25
25 -
 26
26 -
 27
27 -
 28
28 -
 29
29 -
 30
30 -
 31
31 -
32
-
33
-
34
-
35
-
36
-
37
-
38
-
39
-
40
-
41
-
42
-
43
-
44
-
45
-
46
-
47
-
48
-
49
-
50
-
51
-
52
-
53
-
54
-
55
-
56
-
57
-
58
-
59
-
60
-
61
-
62
-
63
-
64
-
65
-
66
-
67
-
68
-
69
-
70
-
71
-
72
-
73
-
74
-
75
-
76
-
77
-
78
-
79
-
80
-
81
-
82
-
83
-
84
-
85
-
86
-
87
 |
 |
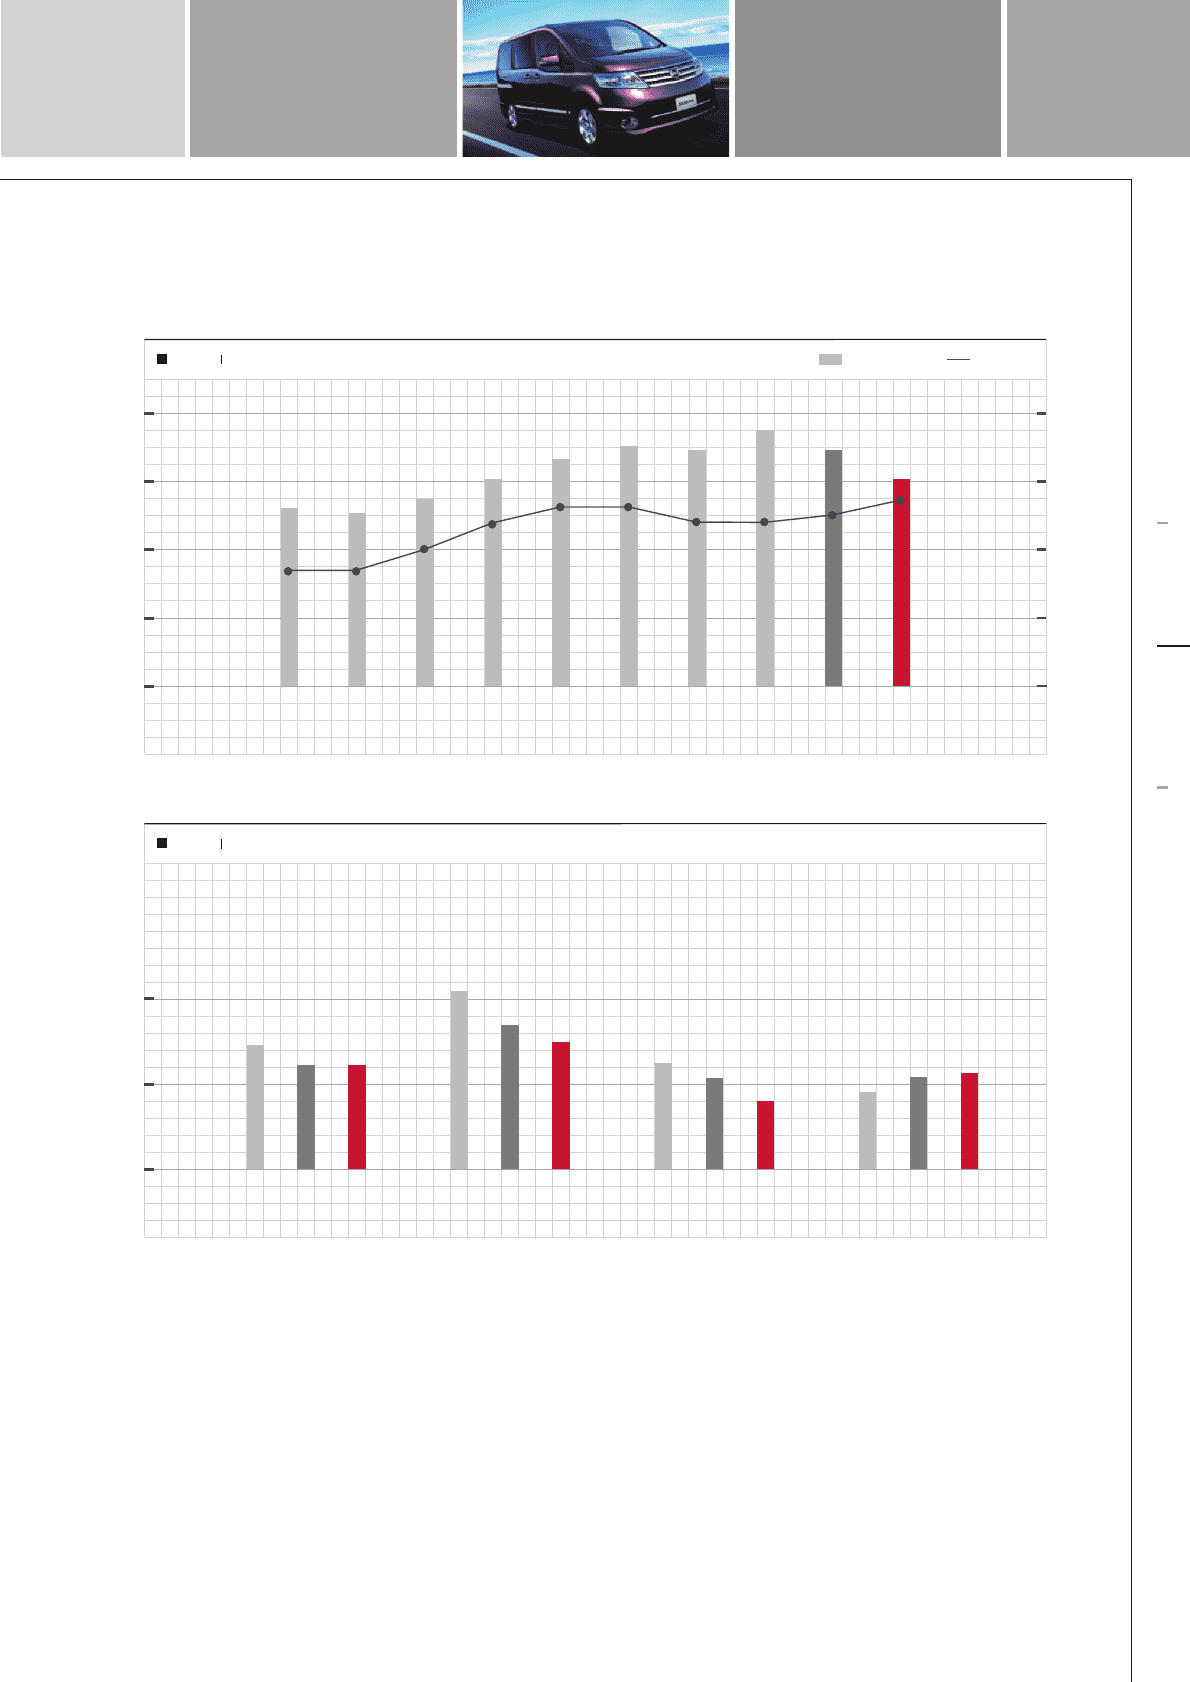
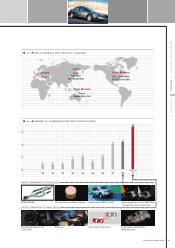
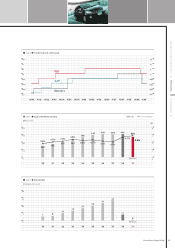
chart 01
<
4,000
0
3,000
2,000
1,000 4
3
5
6
7
2,633
4.7% 4.7%
5.0%
5.3% 5.6% 5.6% 5.4% 5.4% 5.5%
5.7%
2,597 2,771
3,057
3,389
3,411
-9.5%
(Forecast)
3,080
-9.7%
3,569 3,483
3,770
0
1,000
500
China
458
545
+19.1%
570
+4.6%
Europe
636 530
-16.7% 400
-24.5%
Japan
(Forecast)
721 612
-15.1%
612
0.0%
United States
1,059 856
-19.1%
(Forecast) (Forecast)
750
-12.4%
,07
,01 ,02 ,03
,00 ,04 ,05 ,06 ,07 ,08 ,09
,08 ,09 ,07 ,08 ,09 ,07 ,08 ,09
(Forecast)
,07 ,08 ,09
Global retail sales Market share
<
GLOBAL RETAIL SALES VOLUME
(Units: thousands) (%)
chart 02
<
<
RETAIL SALES IN MAJOR MARKETS
(Units: thousands)
Nissan Annual Report 2009 19
Managing Through the Global Crisis Performance Corporate Data
(All figures for fiscal 2009 are forecasts, as of May 12, 2009)