Nissan 2009 Annual Report Download - page 38
Download and view the complete annual report
Please find page 38 of the 2009 Nissan annual report below. You can navigate through the pages in the report by either clicking on the pages listed below, or by using the keyword search tool below to find specific information within the annual report.-
 1
1 -
2
-
3
-
4
-
5
-
6
-
7
-
8
-
9
-
10
-
11
-
12
-
13
-
14
-
15
-
16
-
17
-
18
-
19
-
20
-
21
-
22
-
23
-
24
-
25
-
26
-
27
-
 28
28 -
 29
29 -
 30
30 -
 31
31 -
 32
32 -
 33
33 -
 34
34 -
 35
35 -
 36
36 -
 37
37 -
 38
38 -
 39
39 -
 40
40 -
 41
41 -
 42
42 -
 43
43 -
 44
44 -
 45
45 -
 46
46 -
 47
47 -
 48
48 -
49
-
50
-
51
-
52
-
53
-
54
-
55
-
56
-
57
-
58
-
59
-
60
-
61
-
62
-
63
-
64
-
65
-
66
-
67
-
68
-
69
-
70
-
71
-
72
-
73
-
74
-
75
-
76
-
77
-
78
-
79
-
80
-
81
-
82
-
83
-
84
-
85
-
86
-
87
 |
 |

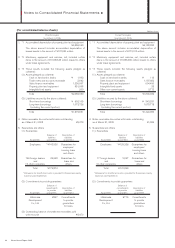
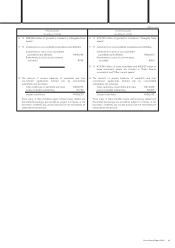
36 Nissan Annual Report 2009
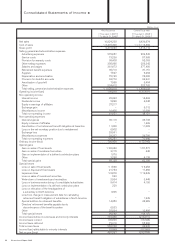
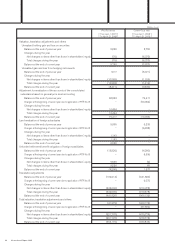
Consolidated Statements of Cash Flows >
Prior Fiscal Year Current Fiscal
Year
From April 1, 2007 From April 1, 2008
[
To March 31, 2008
][
To March 31, 2009
]
Cash flows from operating activities
Income (loss) before income taxes and minority interests 767,958 (218,771)
Depreciation and amortization (for fixed assets excluding leased vehicles) 463,730 438,849
Depreciation and amortization (for other assets) 24,744 25,966
Depreciation and amortization (for leased vehicles) 340,698 301,547
Impairment loss 8,878 19,649
Increase (decrease) in allowance for doubtful receivables (2,552) 27,978
Unrealized loss on investments 1,597 3,047
Provision for residual value risk of leased vehicles 107,354
Interest and dividend income (28,205) (22,711)
Interest expense 159,285 132,853
Loss (gain) on sales of property, plant and equipment (78,551)
Loss (gain) on sales of fixed assets (51,324)
Loss on disposal of fixed assets 21,754 17,456
Loss (gain) on sales of investment securities (3,475) (399)
Decrease (increase) in trade notes and accounts receivable (44,245) 239,067
Decrease (increase) in sales finance receivables (78,851) 377,422
Decrease (increase) in inventories (40,581) 108,393
Increase (decrease) in trade notes and accounts payable 103,123 (488,226)
Amortization of net retirement benefit obligation at transition 11,009 11,023
Retirement benefit expenses 52,260 60,795
Retirement benefit payments made against related accrual (53,303) (35,403)
Other 12,108 34,619
Subtotal 1,637,381 1,089,184
Interest and dividends received 27,770 22,601
Interest paid (157,974) (130,857)
Income taxes paid (164,893) (90,202)
Net cash provided by operating activities 1,342,284 890,726
Cash flows from investing activities
Net decrease (increase) in short-term investments 6,311 (3,681)
Purchases of fixed assets (469,236) (386,122)
Proceeds from sales of property, plant and equipment 131,183
Proceeds from sales of fixed assets 156,261
Purchase of leased vehicles (862,066) (664,077)
Proceeds from sales of leased vehicles 393,418 372,952
Payments of long-term loans receivable (13,900) (21,816)
Collection of long-term loans receivable 10,561 16,321
Purchase of investment securities (35,820) (24,374)
Proceeds from sales of investment securities 7,272 1,618
Purchases of subsidiaries’ shares resulting in changes in the scope of consolidation
*2 (16,032) −
Proceeds from sales of subsidiaries’ shares resulting in changes in the scope of consolidation
1,664 −
Other (20,978) (20,666)
Net cash used in investing activities (867,623) (573,584)
Cash flows from financing activities
Net increase (decrease) in short-term borrowings 25,397 (622,231)
Proceeds from long-term borrowings 834,160 1,561,421
Proceeds from issuance of bonds 236,875 73,336
Repayment of long-term borrowings (1,023,072) (781,986)
Redemption of bonds (101,888) (150,017)
Proceeds from minority shareholders 47 1,991
Purchase of treasury stock (81,341) (34)
Proceeds from sales of treasury stock 33,203 −
Repayment of lease obligations (72,762) (86,630)
Cash dividends paid (151,725) (126,303)
Cash dividends paid to minority shareholders (6,291) (4,574)
Other 395 14
Net cash used in financing activities (307,002) (135,013)
Effects of exchange rate changes on cash and cash equivalents (52,978) (27,760)
Increase (decrease) in cash and cash equivalents 114,681 154,369
Cash and cash equivalents at beginning of the year 469,388 584,102
Increase due to inclusion in consolidation 33 8,441
Cash and cash equivalents at end of the year *1 584,102 *1 746,912
(Millions of yen)