Nissan 2009 Annual Report Download - page 37
Download and view the complete annual report
Please find page 37 of the 2009 Nissan annual report below. You can navigate through the pages in the report by either clicking on the pages listed below, or by using the keyword search tool below to find specific information within the annual report.-
 1
1 -
2
-
3
-
4
-
5
-
6
-
7
-
8
-
9
-
10
-
11
-
12
-
13
-
14
-
15
-
16
-
17
-
18
-
19
-
20
-
21
-
22
-
23
-
24
-
25
-
26
-
 27
27 -
 28
28 -
 29
29 -
 30
30 -
 31
31 -
 32
32 -
 33
33 -
 34
34 -
 35
35 -
 36
36 -
 37
37 -
 38
38 -
 39
39 -
 40
40 -
 41
41 -
 42
42 -
 43
43 -
 44
44 -
 45
45 -
 46
46 -
 47
47 -
48
-
49
-
50
-
51
-
52
-
53
-
54
-
55
-
56
-
57
-
58
-
59
-
60
-
61
-
62
-
63
-
64
-
65
-
66
-
67
-
68
-
69
-
70
-
71
-
72
-
73
-
74
-
75
-
76
-
77
-
78
-
79
-
80
-
81
-
82
-
83
-
84
-
85
-
86
-
87
 |
 |

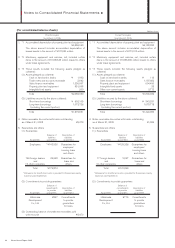
Nissan Annual Report 2009 35
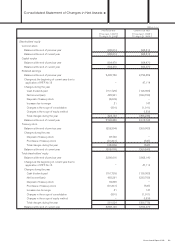
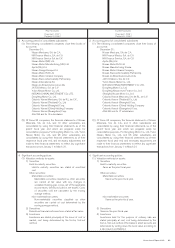
Prior Fiscal Year Current Fiscal
Year
From April 1, 2007 From April 1, 2008
[
To March 31, 2008
][
To March 31, 2009
]
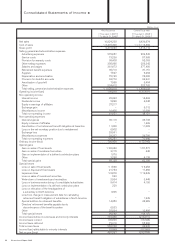
Share subscription rights
Balance at the end of previous year 2,711 1,714
Changes during the year
Net changes in items other than those in shareholders’ equity (997) 375
Total changes during the year (997) 375
Balance at the end of current year 1,714 2,089
Minority interests
Balance at the end of previous year 329,046 342,765
Changes at the beginning of current year due to application of PITF No.18
−(898)
Changes during the year
Net changes in items other than those in shareholders’ equity 13,719 (43,536)
Total changes during the year 13,719 (43,536)
Balance at the end of current year 342,765 298,331
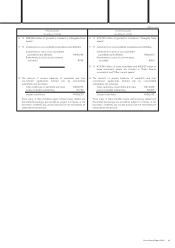
Total net assets
Balance at the end of previous year 3,876,994 3,849,443
Changes at the beginning of current year due to application of PITF No.18
−(41,676)
Changes during the year
Cash dividends paid (151,725) (126,303)
Net income (loss) 482,261 (233,709)
Disposal of treasury stock 32,699 −
Purchases of treasury stock (81,341) (537)
Increase due to merger 21 147
Changes in the scope of consolidation (391) (1,911)
Changes in the scope of equity method −3,538
Net changes in items other than those in shareholders’ equity (309,075) (522,939)
Total changes during the year (27,551) (881,714)
Balance at the end of current year 3,849,443 2,926,053
(Millions of yen)