Nissan 2009 Annual Report Download - page 77
Download and view the complete annual report
Please find page 77 of the 2009 Nissan annual report below. You can navigate through the pages in the report by either clicking on the pages listed below, or by using the keyword search tool below to find specific information within the annual report.-
 1
1 -
2
-
3
-
4
-
5
-
6
-
7
-
8
-
9
-
10
-
11
-
12
-
13
-
14
-
15
-
16
-
17
-
18
-
19
-
20
-
21
-
22
-
23
-
24
-
25
-
26
-
27
-
28
-
29
-
30
-
31
-
32
-
33
-
34
-
35
-
36
-
37
-
38
-
39
-
40
-
41
-
42
-
43
-
44
-
45
-
46
-
47
-
48
-
49
-
50
-
51
-
52
-
53
-
54
-
55
-
56
-
57
-
58
-
59
-
60
-
61
-
62
-
63
-
64
-
65
-
66
-
 67
67 -
 68
68 -
 69
69 -
 70
70 -
 71
71 -
 72
72 -
 73
73 -
 74
74 -
 75
75 -
 76
76 -
 77
77 -
 78
78 -
 79
79 -
 80
80 -
 81
81 -
 82
82 -
 83
83 -
 84
84 -
 85
85 -
 86
86 -
 87
87
 |
 |

Nissan Annual Report 2009 75
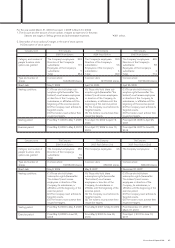
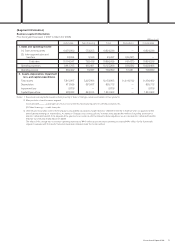
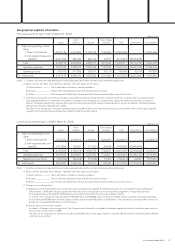
4. Consolidated financial statements by business segment
• The Sales financing segment consists of Nissan Financial Services Co., Ltd. (Japan), Nissan Motor Acceptance Corporation (USA), NR Finance Mexico
S.A. de C.V. SOFOM E.N.R (Mexico) and other 7 companies, totaling 10 companies, and sales finance operations of Nissan Canada Inc. (Canada).
•The financial data on Automobile & Eliminations represent the differences between the consolidated figures and those for the Sales financing segment.
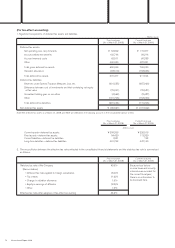
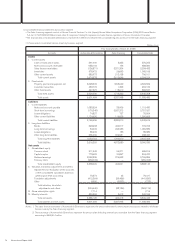
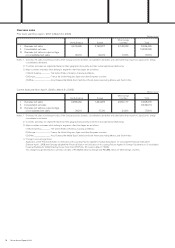
(1) Summarized consolidated balance sheets by business segment
(Millions of yen)
Current fiscal year (As of March 31, 2009)
Accounts Automobile & Eliminations Sales financing Consolidated total
Assets
I. Current assets
Cash on hand and in banks 621,783 10,931 632,714
Notes and accounts receivable 428,858 220 429,078
Sales finance receivables (89,940) 2,800,192 2,710,252
Inventories 734,366 25,704 760,070
Other current assets 494,708 252,560 747,268
Total current assets 2,189,775 3,089,607 5,279,382
II. Fixed assets
Property, plant and equipment, net 2,770,034 1,340,013 4,110,047
Investment securities 299,208 1,369 300,577
Other fixed assets 341,665 207,869 549,534
Total fixed assets 3,410,907 1,549,251 4,960,158
Total assets 5,600,682 4,638,858 10,239,540
Liabilities
I. Current liabilities
Notes and accounts payable 596,998 24,906 621,904
Short-term borrowings 126,893 2,164,593 2,291,486
Lease obligations 71,177 202 71,379
Other current liabilities 898,165 105,760 1,003,925
Total current liabilities 1,693,233 2,295,461 3,988,694
II. Long-term liabilities
Bonds 297,976 297,333 595,309
Long-term borrowings 507,909 1,192,106 1,700,015
Lease obligations 105,278 261 105,539
Other long-term liabilities 493,553 430,377 923,930
Total long-term liabilities 1,404,716 1,920,077 3,324,793
Total liabilities 3,097,949 4,215,538 7,313,487
Net assets
I. Shareholders’ equity
Common stock 499,807 106,007 605,814
Capital surplus 773,623 30,847 804,470
Retained earnings 2,065,907 349,828 2,415,735
Treasury stock (269,540) — (269,540)
Total shareholders’ equity 3,069,797 486,682 3,556,479
II. Valuation, translation adjustments and others
Adjustments for revaluation of the accounts
of the consolidated subsidiaries based on
general price level accounting (13,945) — (13,945)
Translation adjustments (847,609) (58,517) (906,126)
Other 5 (10,780) (10,775)
Total valuation, translation
adjustments and others (861,549) (69,297) (930,846)
III. Share subscription rights 2,089 — 2,089
IV. Minority interests 292,396 5,935 298,331
Total net assets 2,502,733 423,320 2,926,053
Total liabilities and net assets 5,600,682 4,638,858 10,239,540
Notes: 1. The sales finance receivables of Automobile & Eliminations represents the amount eliminated for intercompany transactions related to wholesale
finance made by the Sales financing segment.
2. The borrowings of Automobile & Eliminations represent the amount after deducting internal loans receivable from the Sales financing segment
amounting to ¥611,588 million.