Nissan 2009 Annual Report Download - page 34
Download and view the complete annual report
Please find page 34 of the 2009 Nissan annual report below. You can navigate through the pages in the report by either clicking on the pages listed below, or by using the keyword search tool below to find specific information within the annual report.-
 1
1 -
2
-
3
-
4
-
5
-
6
-
7
-
8
-
9
-
10
-
11
-
12
-
13
-
14
-
15
-
16
-
17
-
18
-
19
-
20
-
21
-
22
-
23
-
 24
24 -
 25
25 -
 26
26 -
 27
27 -
 28
28 -
 29
29 -
 30
30 -
 31
31 -
 32
32 -
 33
33 -
 34
34 -
 35
35 -
 36
36 -
 37
37 -
 38
38 -
 39
39 -
 40
40 -
 41
41 -
 42
42 -
 43
43 -
 44
44 -
45
-
46
-
47
-
48
-
49
-
50
-
51
-
52
-
53
-
54
-
55
-
56
-
57
-
58
-
59
-
60
-
61
-
62
-
63
-
64
-
65
-
66
-
67
-
68
-
69
-
70
-
71
-
72
-
73
-
74
-
75
-
76
-
77
-
78
-
79
-
80
-
81
-
82
-
83
-
84
-
85
-
86
-
87
 |
 |

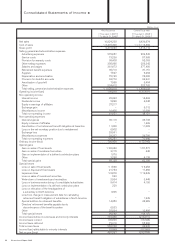
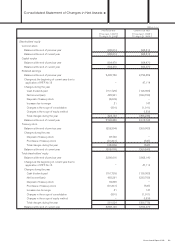
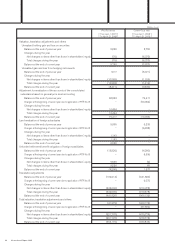
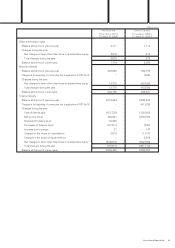
32 Nissan Annual Report 2009
Prior Fiscal Year Current Fiscal
Year
From April 1, 2007 From April 1, 2008
[
To March 31, 2008
][
To March 31, 2009
]
Net sales 10,824,238 8,436,974
Cost of sales *1 8,407,398 *1,*2 7,118,862
Gross profit 2,416,840 1,318,112
Selling, general and administrative expenses
Advertising expenses 275,857 223,542
Service costs 73,236 57,968
Provision for warranty costs 95,408 92,093
Other selling expenses 395,095 259,342
Salaries and wages 381,673 377,456
Retirement benefit expenses 35,719 37,151
Supplies 7,527 6,264
Depreciation and amortization 75,742 78,020
Provision for doubtful accounts 43,776 94,941
Amortization of goodwill 7,565 6,494
Other 234,412 222,762
Total selling, general and administrative expenses *1 1,626,010 *1 1,456,033
Operating income (loss) 790,830 (137,921)
Non-operating income
Interest income 25,343 18,663
Dividends income 2,862 4,048
Equity in earnings of affiliates 37,217 −
Exchange gain −5,012
Miscellaneous income 16,405 10,398
Total non-operating income 81,827 38,121
Non-operating expenses
Interest expense 36,118 33,798
Equity in losses of affiliates −1,369
Amortization of net retirement benefit obligation at transition 11,009 11,023
Loss on the net monetary position due to restatement 6,902 −
Exchange loss 28,991 −
Miscellaneous expenses 23,237 26,750
Total non-operating expenses 106,257 72,940
Ordinary income (loss) 766,400 (172,740)
Special gains
Gain on sales of fixed assets *2 80,089 *3 57,577
Gain on sales of investment securities 3,715 440
Gain on implementation of a defined contribution plans 1,076
Other 3,258 4,139
Total special gains 88,138 62,156
Special losses
Loss on sale of fixed assets *2 1,538 *3 6,253
Loss on disposal of fixed assets 21,754 17,456
Impairment loss *3 8,878 *4 19,649
Loss on sales of investment securities 240
Write-down of investments and receivables 2,934 3,449
Loss on business restructuring of consolidated subsidiaries 5,414 4,150
Loss on implementation of a defined contribution plans 220
Loss on relocation of the headquarters of
a subsidiary in North America 1,895 −
Loss from change in measurement date for calculating
retirement benefit obligation of subsidiaries in North America −1,949
Special addition to retirement benefits 14,350 42,389
Directors’ retirement benefits payable due to
discontinuance of the benefits system 6,533 −
Other 22,824 12,892
Total special losses 86,580 108,187
Income (loss) before income taxes and minority interests 767,958 (218,771)
Income taxes-current 190,690 (18,348)
Income taxes-deferred 72,018 55,286
Total income taxes 262,708 36,938
Income (loss) attributable to minority interests 22,989 (22,000)
Net income (loss) 482,261 (233,709)
(Millions of yen)
Consolidated Statements of Income >