Nissan 2009 Annual Report Download - page 80
Download and view the complete annual report
Please find page 80 of the 2009 Nissan annual report below. You can navigate through the pages in the report by either clicking on the pages listed below, or by using the keyword search tool below to find specific information within the annual report.-
 1
1 -
2
-
3
-
4
-
5
-
6
-
7
-
8
-
9
-
10
-
11
-
12
-
13
-
14
-
15
-
16
-
17
-
18
-
19
-
20
-
21
-
22
-
23
-
24
-
25
-
26
-
27
-
28
-
29
-
30
-
31
-
32
-
33
-
34
-
35
-
36
-
37
-
38
-
39
-
40
-
41
-
42
-
43
-
44
-
45
-
46
-
47
-
48
-
49
-
50
-
51
-
52
-
53
-
54
-
55
-
56
-
57
-
58
-
59
-
60
-
61
-
62
-
63
-
64
-
65
-
66
-
67
-
68
-
69
-
 70
70 -
 71
71 -
 72
72 -
 73
73 -
 74
74 -
 75
75 -
 76
76 -
 77
77 -
 78
78 -
 79
79 -
 80
80 -
 81
81 -
 82
82 -
 83
83 -
 84
84 -
 85
85 -
 86
86 -
 87
87
 |
 |

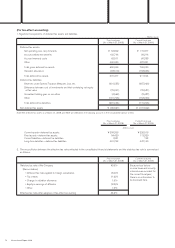
78 Nissan Annual Report 2009
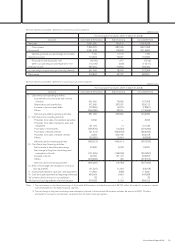
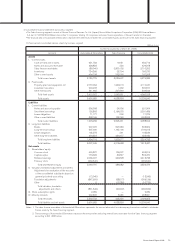
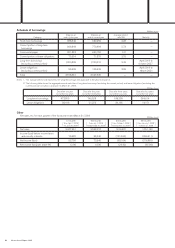
Prior fiscal year (from April 1, 2007 to March 31, 2008)
(Millions of yen)
Other foreign
North America Europe countries Total
I. Overseas net sales 4,319,665 2,168,427 2,148,343 8,636,435
II. Consolidated net sales 10,824,238
III. Overseas net sales as a percentage
of consolidated net sales 39.9% 20.0% 19.9% 79.8%
Notes: 1. Overseas net sales include export sales of the Company and its domestic consolidated subsidiaries and sales (other than exports to Japan) of its foreign
consolidated subsidiaries.
2. Countries and areas are segmented based on their geographical proximity and their mutual operational relationship.
3. Major countries and areas which belong to segments other than Japan are as follows:
(1) North America ......................... The United States of America, Canada, and Mexico
(2) Europe............................................ France, the United Kingdom, Spain and other European countries
(3) Other................................................ Asia, Oceania, the Middle East, Central and South America excluding Mexico, and South Africa
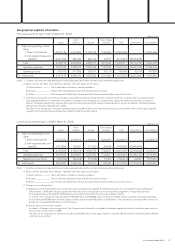
Current fiscal year (from April 1, 2008 to March 31, 2009)
(Millions of yen)
Other foreign
North America Europe countries Total
I. Overseas net sales 2,884,262 1,464,299 2,050,117 6,398,678
II. Consolidated net sales 8,436,974
III. Overseas net sales as a percentage
of consolidated net sales 34.2% 17.3% 24.3% 75.8%
Notes: 1. Overseas net sales include export sales of the Company and its domestic consolidated subsidiaries and sales (other than exports to Japan) of its foreign
consolidated subsidiaries.
2. Countries and areas are segmented based on their geographical proximity and their mutual operational relationship.
3. Major countries and areas which belong to segments other than Japan are as follows:
(1) North America......................... The United States of America, Canada, and Mexico
(2) Europe........................................... France, the United Kingdom, Spain and other European countries
(3) Other............................................... Asia, Oceania, the Middle East, Central and South America excluding Mexico, and South Africa
4. Change in accounting policies:
Application of the “Practical Solution on Unification of Accounting Policies Applied to Foreign Subsidiaries for Consolidated Financial Statements”
Effective April 1, 2008, the Company adopted the “Practical Solution on Unification of Accounting Policies Applied to Foreign Subsidiaries for Consolidated
Financial Statements” (ASBJ Practical Issues Task Force (PITF) No. 18 issued on May 17, 2006).
This change brought decreases in overseas net sales of ¥136,262 million for Europe and ¥23,883 million for Other foreign countries.
Overseas sales