Nissan 2009 Annual Report Download - page 24
Download and view the complete annual report
Please find page 24 of the 2009 Nissan annual report below. You can navigate through the pages in the report by either clicking on the pages listed below, or by using the keyword search tool below to find specific information within the annual report.-
 1
1 -
2
-
3
-
4
-
5
-
6
-
7
-
8
-
9
-
10
-
11
-
12
-
13
-
 14
14 -
 15
15 -
 16
16 -
 17
17 -
 18
18 -
 19
19 -
 20
20 -
 21
21 -
 22
22 -
 23
23 -
 24
24 -
 25
25 -
 26
26 -
 27
27 -
 28
28 -
 29
29 -
 30
30 -
 31
31 -
 32
32 -
 33
33 -
 34
34 -
35
-
36
-
37
-
38
-
39
-
40
-
41
-
42
-
43
-
44
-
45
-
46
-
47
-
48
-
49
-
50
-
51
-
52
-
53
-
54
-
55
-
56
-
57
-
58
-
59
-
60
-
61
-
62
-
63
-
64
-
65
-
66
-
67
-
68
-
69
-
70
-
71
-
72
-
73
-
74
-
75
-
76
-
77
-
78
-
79
-
80
-
81
-
82
-
83
-
84
-
85
-
86
-
87
 |
 |

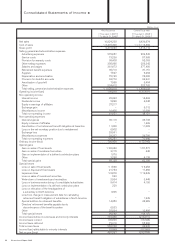
Fiscal 2008 Financial Performance
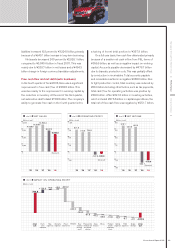
Net sales Refer to chart 05
Net revenues decreased 22.1 percent, to ¥8,437.0 billion.
Regarding this decline, 11 percent was due to volume
and mix, 9 percent to foreign exchange, and 2 percent to
accounting changes.
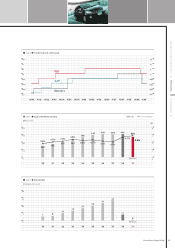
Operating profit Refer to chart 06, 08
Operating profit totaled a negative ¥137.9 billion, which
was a decrease of ¥928.7 billion from ¥790.8 billion in
fiscal 2007. The variance in operating profit was due to
the following factors:
●Purchasing cost reduction generated a positive
contribution of ¥134.6 billion
●Decreased manufacturing expenses were a positive
¥8.2 billion
●A decrease in warranty expenses resulted in a
positive contribution of ¥5.6 billion
●Volume and mix, including sales price increases,
produced a negative impact of ¥525.2 billion, which
was due to the decrease in global sales volume and
the mix deterioration in Japan and the U.S.
●The ¥223.0 billion negative impact from foreign
exchange was mainly from the U.S. dollar and the
Russian ruble
●
The increase in raw material and energy costs,including
steel,oil and other commodities, was a negative ¥134.2
billion. Although the market price of commodities
declined at the end of fiscal 2008, there is a time
lag before the positive benefits affect the P&L.
●The negative impact from the increase in provision
for residual risk on leased vehicles in North America
had a negative impact of ¥91.8 billion. Compared to
initial projections, used-car prices for the lease
portfolio are still down. Even though there were
positive trends in the U.S. in February and March
2009, the company is still cautious about whether or
not this trend will continue in fiscal 2009. Based on
internal assessment, the company increased this
provision in the fourth quarter.
●Profit from the sales finance division deteriorated by
¥40.2 billion, primarily because of higher credit loss
provisions
●Product enrichment, including regulatory costs,
lowered profits by ¥13.8 billion
●Selling expenses had a ¥9.3 billion negative impact
●Higher R&D expenses created a negative impact of
¥8.7 billion
●Scope of consolidation changes had a negative
impact of ¥4.3 billion
●The negative impact from others, including affiliated
companies such as domestic dealers and Calsonic
Kansei, was ¥26.6 billion
Net income Refer to chart 07
Net non-operating expenses increased by ¥10.4 billion
to ¥34.8 billion from ¥24.4 billion in fiscal 2007. Despite
foreign exchange gains, which improved by ¥34.0 billion
to ¥5.0 billion from last year’s losses of ¥29.0 billion, the
negative impact came from the decreased equity in
earnings of affiliates by ¥38.6 billion and increased net
financial cost by ¥3.2 billion to ¥11.1 billion from last
year’s ¥7.9 billion.
Net extraordinary losses totaled ¥46.1 billion, a
decrease of ¥47.7 billion from the previous year’s gain
of ¥1.6 billion. This negative variance came from the
decreased extraordinary gain by ¥26.0 billion primarily
because of the decreased gain on sale of fixed assets,
and increased extraordinary losses by ¥21.7 billion due
mainly to impairment losses and special additions to
retirement benefits at overseas subsidiaries.
Taxes totaled ¥36.9 billion, a decrease of ¥225.8
billion from fiscal 2007. Minority interests had a positive
contribution of ¥22.0 billion in fiscal 2008.
Net losses totaled ¥233.7 billion, a decrease of
¥716.0 billion from fiscal 2007.
Financial Position
Balance sheet
In fiscal 2008, Nissan’s total assets decreased 14.2
percent to ¥10,239.5 billion. Current assets decreased
16.1 percent to ¥5,279.4 billion. The main reasons were
a decrease in finance receivables of ¥524.2 billion and
trade notes and accounts receivable of ¥259.2 billion.
Fixed assets decreased to ¥4,960.2 billion, representing
a 12.1 percent decline. The main reason was a decrease
in machinery, equipment and vehicles of ¥368.1 billion.
Current liabilities decreased 23.9 percent to ¥3,988.7
billion. This is mainly due to the decrease in trade notes
and accounts payable of ¥497.5 billion. Total long-term
Financial Review >
22 Nissan Annual Report 2009