Nissan 2009 Annual Report Download - page 78
Download and view the complete annual report
Please find page 78 of the 2009 Nissan annual report below. You can navigate through the pages in the report by either clicking on the pages listed below, or by using the keyword search tool below to find specific information within the annual report.-
 1
1 -
2
-
3
-
4
-
5
-
6
-
7
-
8
-
9
-
10
-
11
-
12
-
13
-
14
-
15
-
16
-
17
-
18
-
19
-
20
-
21
-
22
-
23
-
24
-
25
-
26
-
27
-
28
-
29
-
30
-
31
-
32
-
33
-
34
-
35
-
36
-
37
-
38
-
39
-
40
-
41
-
42
-
43
-
44
-
45
-
46
-
47
-
48
-
49
-
50
-
51
-
52
-
53
-
54
-
55
-
56
-
57
-
58
-
59
-
60
-
61
-
62
-
63
-
64
-
65
-
66
-
67
-
 68
68 -
 69
69 -
 70
70 -
 71
71 -
 72
72 -
 73
73 -
 74
74 -
 75
75 -
 76
76 -
 77
77 -
 78
78 -
 79
79 -
 80
80 -
 81
81 -
 82
82 -
 83
83 -
 84
84 -
 85
85 -
 86
86 -
 87
87
 |
 |
76 Nissan Annual Report 2009
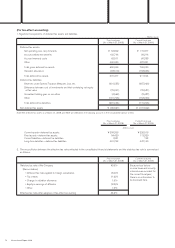
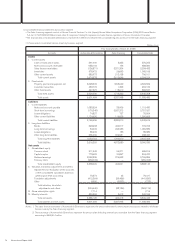
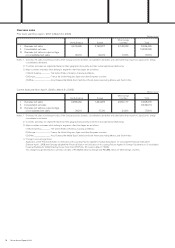
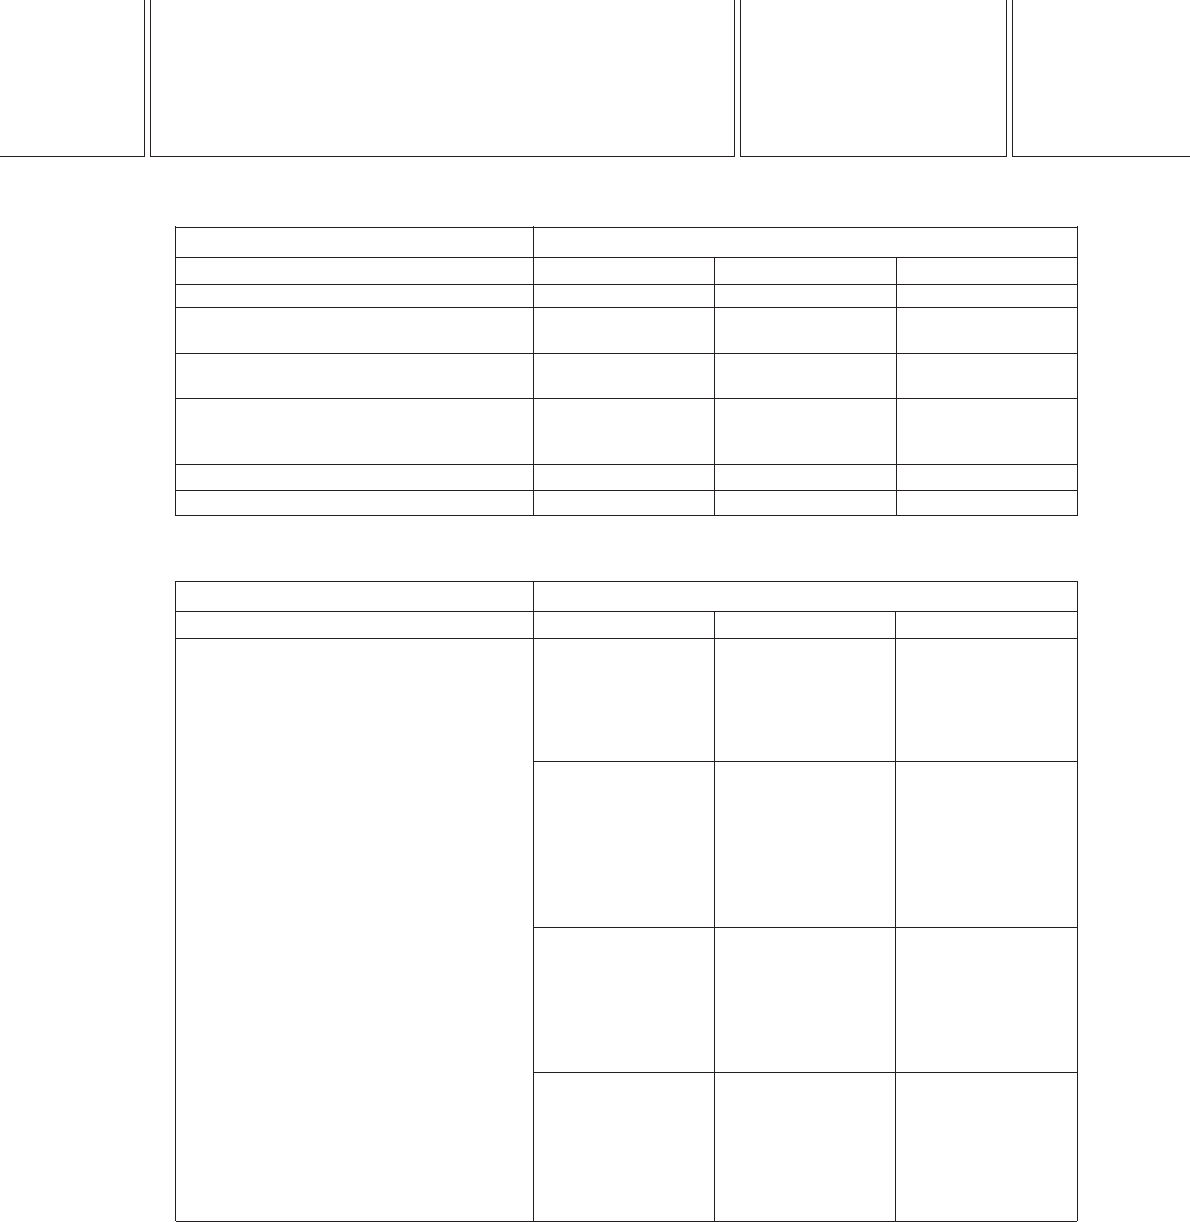
(2) Summarized consolidated statements of income by business segment
(Millions of yen)
Current fiscal year (From April 1, 2008 to March 31, 2009)
Accounts Automobile & Eliminations Sales financing Consolidated total
Net sales 7,760,173 676,801 8,436,974
Cost of sales 6,613,295 505,567 7,118,862
Gross profit 1,146,878 171,234 1,318,112
Operating income as a percentage of net sales (2.2%) 4.9% (1.6%)
Operating income (loss) (171,089) 33,168 (137,921)
Net financial cost (11,288) 201 (11,087)
Others (21,696) (2,036) (23,732)
Ordinary income (loss) (204,073) 31,333 (172,740)
Income (loss) before income taxes and minority interests
(248,604) 29,833 (218,771)
Net income (loss) (251,648) 17,939 (233,709)
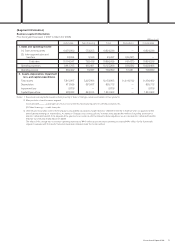
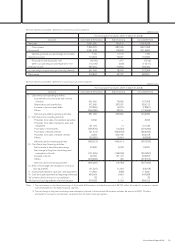
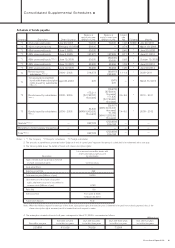
(3) Summarized consolidated statements of cash flows by business segment
(Millions of yen)
Current fiscal year (From April 1, 2008 to March 31, 2009)
Accounts Automobile & Eliminations Sales financing Consolidated total
I. Cash flows from operating activities
Income (loss) before income taxes and minority
interests (248,604) 29,833 (218,771)
Depreciation and amortization 450,391 315,971 766,362
Decrease (increase) in finance receivables (46,000) 423,422 377,422
Others (115,828) 81,541 (34,287)
Net cash provided by operating activities 39,959 850,767 890,726
II. Cash flows from investing activities
Proceeds from sales of investment securities 1,468 150 1,618
Proceeds from sales of fixed assets 154,750 1,511 156,261
Purchases of fixed assets (376,634) (9,488) (386,122)
Purchases of leased vehicles (27,441) (636,636) (664,077)
Proceeds from sales of leased vehicles 1,683 371,269 372,952
Others (45,497) (8,719) (54,216)
Net cash used in investing activities (291,671) (281,913) (573,584)
III. Cash flows from financing activities
Net increase (decrease) in short-term borrowings
225,602 (847,833) (622,231)
Net change in long-term borrowings and
redemption of bonds 378,046 251,372 629,418
Increase in bonds — 73,336 73,336
Others (179,780) (35,756) (215,536)
Net cash provided by (used in) financing activities
423,868 (558,881) (135,013)
IV. Effect of exchange rate changes on cash and
cash equivalents (23,848) (3,912) (27,760)
V. Increase in cash and cash equivalents 148,308 6,061 154,369
VI. Cash and cash equivalents at beginning of the year 574,963 9,139 584,102
VII. Increase due to inclusion in consolidation 2,387 6,054 8,441
VIII.Cash and cash equivalents at end of the year 725,658 21,254 746,912
Notes 1. The net increase in short-term borrowings of Automobile & Eliminations includes the amount of ¥343,504 million eliminated for decrease in
internal loans receivable from the Sales financing segment.
2. The net change in long-term borrowings and redemption of bonds of Automobile & Eliminations includes the amount of ¥112,109 million
eliminated for increase in internal loans receivable from the Sales financing segment.