Nissan 2009 Annual Report Download - page 5
Download and view the complete annual report
Please find page 5 of the 2009 Nissan annual report below. You can navigate through the pages in the report by either clicking on the pages listed below, or by using the keyword search tool below to find specific information within the annual report.-
 1
1 -
 2
2 -
 3
3 -
 4
4 -
 5
5 -
 6
6 -
 7
7 -
 8
8 -
 9
9 -
 10
10 -
 11
11 -
 12
12 -
 13
13 -
 14
14 -
 15
15 -
 16
16 -
17
-
18
-
19
-
20
-
21
-
22
-
23
-
24
-
25
-
26
-
27
-
28
-
29
-
30
-
31
-
32
-
33
-
34
-
35
-
36
-
37
-
38
-
39
-
40
-
41
-
42
-
43
-
44
-
45
-
46
-
47
-
48
-
49
-
50
-
51
-
52
-
53
-
54
-
55
-
56
-
57
-
58
-
59
-
60
-
61
-
62
-
63
-
64
-
65
-
66
-
67
-
68
-
69
-
70
-
71
-
72
-
73
-
74
-
75
-
76
-
77
-
78
-
79
-
80
-
81
-
82
-
83
-
84
-
85
-
86
-
87
 |
 |

Nissan Annual Report 2009 03
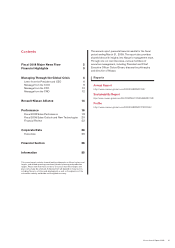
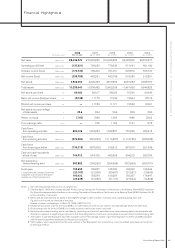
Financial Highlights >
Managing Through the Global Crisis Performance Corporate Data
2008 2007 2006 2005 2004
For the years ended Mar. 31, 2009 Mar. 31, 2008 Mar. 31, 2007 Mar. 31, 2006 Mar. 31, 2005
Net sales Millions of yen ¥8,436,974 ¥10,824,238 ¥10,468,583 ¥9,428,292 ¥8,576,277
Operating profit (loss) Millions of yen (137,921) 790,830 776,939 871,841 861,160
Ordinary income (loss) Millions of yen (172,740) 766,400 761,051 845,872 855,700
Net income (loss) Millions of yen (233,709) 482,261 460,796 518,050 512,281
Net assets Millions of yen 2,926,053 3,849,443 3,876,994 3,087,983 2,465,750
Total assets Millions of yen 10,239,540 11,939,482 12,402,208 11,481,426 9,848,523
Net assets per share Yen 644.60 860.17 862.29 753.40 604.49
Basic net income (loss) per share Yen (57.38) 117.76 112.33 126.94 125.16
Diluted net income per share Yen —117.56 111.71 125.96 124.01
Net assets as a percentage
of total assets %25.6 29.4 28.6 26.9 25.0
Return on equity %(7.62) 13.68 13.89 18.66 22.82
Price earnings ratio Times —7.00 11.24 11.01 8.78
Cash flows
from operating activities Millions of yen 890,726 1,342,284 1,042,827 757,869 369,415
Cash flows
from investing activities Millions of yen (573,584) (867,623) (1,114,587) (1,112,755) (865,035)
Cash flows
from financing activities Millions of yen (135,013) (307,002) 106,912 457,919 521,046
Cash and cash equivalents
at end of year Millions of yen 746,912 584,102 469,388 404,212 289,784
Net automotive
interest-bearing debt Millions of yen 387,882 (180,232) (254,638) (372,893) (205,791)
Employees Number 155,659 159,227 165,729 162,099 169,644
( ) represents the number of part-time (20,107) (21,308) (20,607) (21,257) (13,963)
employees not included in the above 160,422 163,099 169,299 165,397 174,647
numbers as of the fiscal year end (20,649) (21,686) (21,177) (21,564) (14,802)
Notes: 1. Net sales are presented exclusive of consumption tax.
2. Effective April 1, 2006, the Company adopted the Accounting Standard for Presentation of Net Assets in the Balance Sheet (ASBJ Statement
No. 5) and the Implementation Guidance on Accounting Standard for Presentation of Net Assets in the Balance Sheet (ASBJ Guidance No. 8)
in the calculation of net assets.
3. Net income per share amounts are based on the weighted average number of shares of common stock outstanding during each year.
Figures for net income per share are in exact yen.
Number of shares outstanding as of March 31, 2009: 4,520,715,112.
4. Diluted net income per share for the fiscal 2008 is not stated because a net loss per share is recorded although dilutive securities exist.
5. Price earnings ratio for the fiscal 2008 is not stated because a net loss per share is recorded.
6. Net automotive interest-bearing debt is calculated by subtracting cash and cash equivalents from interest-bearing debt in the automobile and
eliminations segment. A negative figure represents that the ending balance of cash and cash equivalents exceeds that of interest-bearing debt.
7. The number of part-time employees has been changed to present the average number of part-time employees for the fiscal 2008 compared
with the year-end part-time employees for the previous fiscal years.
8. Staff numbers, which are presented as the lower numbers in the “Employees” line, include those of unconsolidated subsidiaries accounted for
by the equity method.