Nissan 2009 Annual Report Download - page 53
Download and view the complete annual report
Please find page 53 of the 2009 Nissan annual report below. You can navigate through the pages in the report by either clicking on the pages listed below, or by using the keyword search tool below to find specific information within the annual report.-
 1
1 -
2
-
3
-
4
-
5
-
6
-
7
-
8
-
9
-
10
-
11
-
12
-
13
-
14
-
15
-
16
-
17
-
18
-
19
-
20
-
21
-
22
-
23
-
24
-
25
-
26
-
27
-
28
-
29
-
30
-
31
-
32
-
33
-
34
-
35
-
36
-
37
-
38
-
39
-
40
-
41
-
42
-
 43
43 -
 44
44 -
 45
45 -
 46
46 -
 47
47 -
 48
48 -
 49
49 -
 50
50 -
 51
51 -
 52
52 -
 53
53 -
 54
54 -
 55
55 -
 56
56 -
 57
57 -
 58
58 -
 59
59 -
 60
60 -
 61
61 -
 62
62 -
 63
63 -
64
-
65
-
66
-
67
-
68
-
69
-
70
-
71
-
72
-
73
-
74
-
75
-
76
-
77
-
78
-
79
-
80
-
81
-
82
-
83
-
84
-
85
-
86
-
87
 |
 |
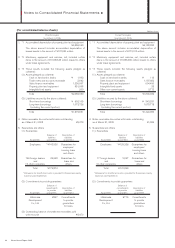
Prior fiscal year Current fiscal year
From April 1, 2007 From April 1, 2008
[
To March 31, 2008
][
To March 31, 2009
]
(Millions of yen)
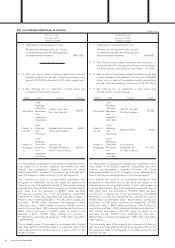
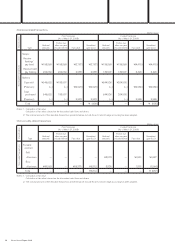
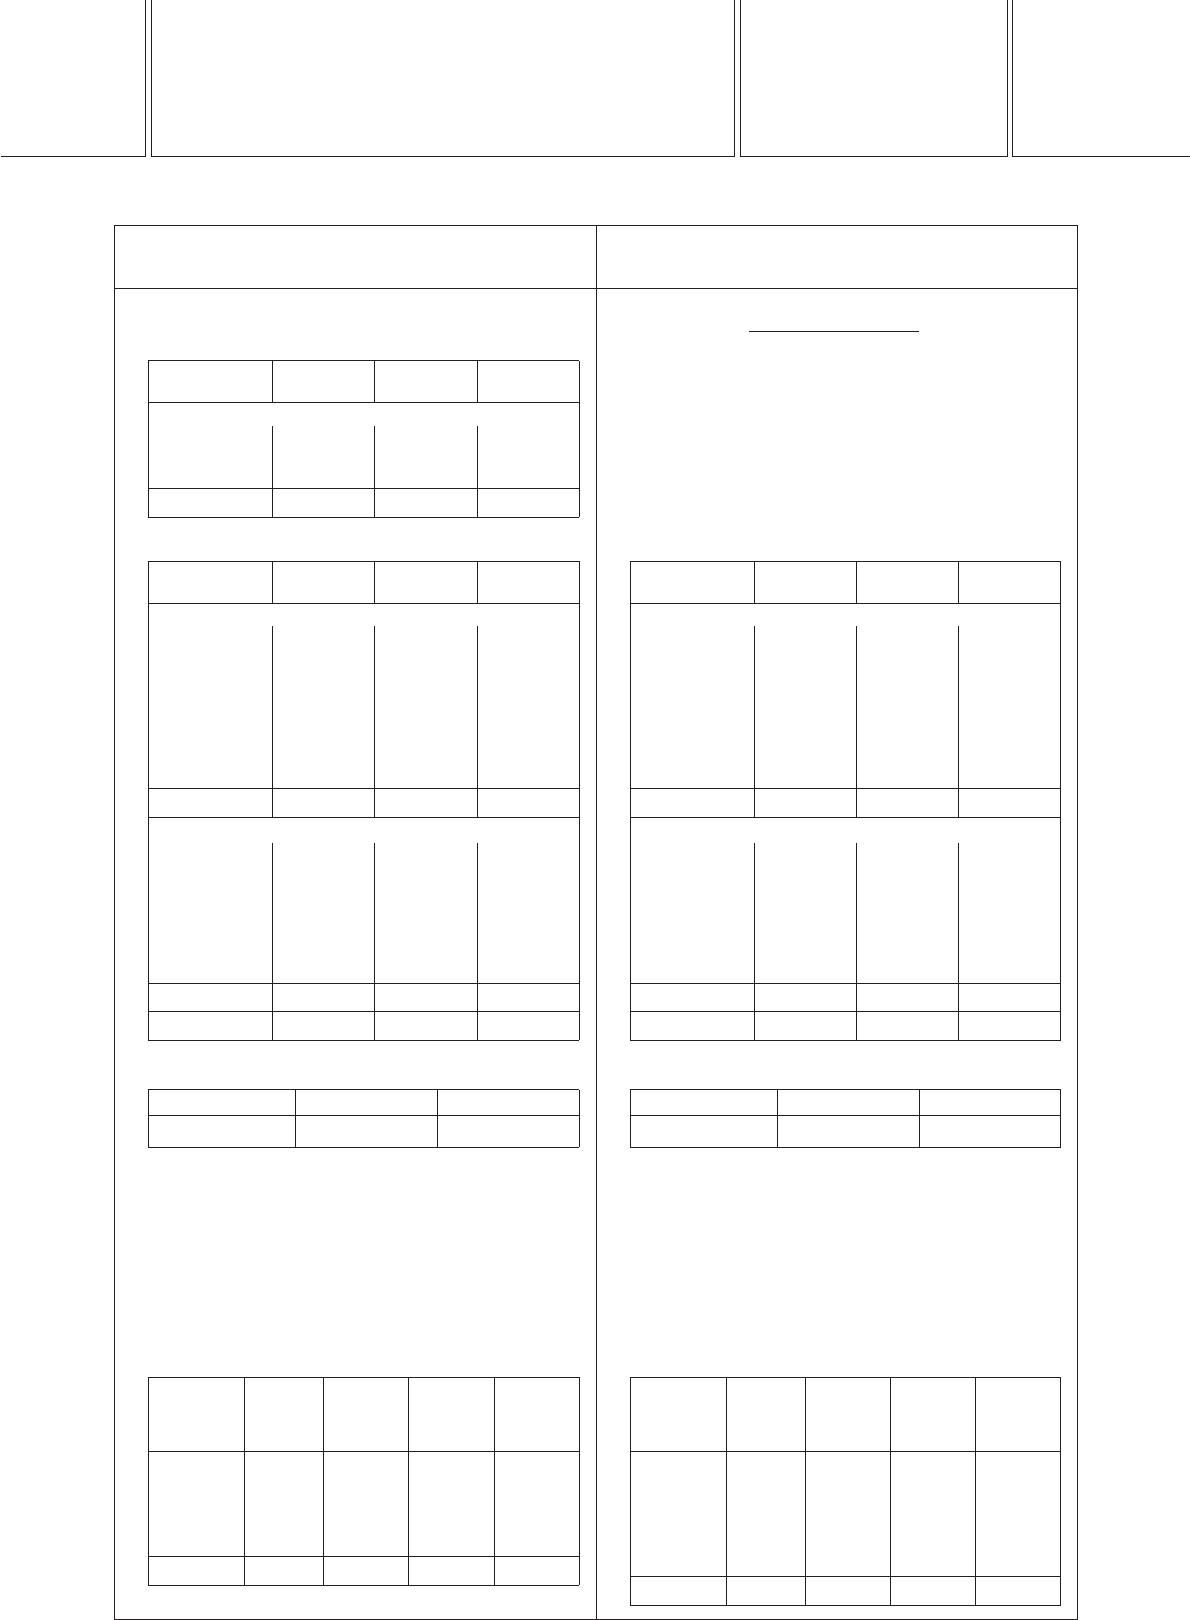
Securities
1. Marketable held-to-maturity debt securities
(As of March 31, 2008)
Types of Carrying Estimated Unrealized
securities value fair value gain (loss)
(Securities whose fair value does not exceed their carrying value)
Government
bonds
¥77 ¥77
—
Corporate bonds — — —
Total
¥77 ¥77 —
2. Marketable other securities
(As of March 31, 2008)
Types of Acquisition Carrying Unrealized
securities cost value gain (loss)
(Securities whose carrying value exceed their acquisition cost)
Stock ¥4,464 ¥16,226 ¥11,762
Bonds:
Government
bonds — — —
Corporate
bonds — — —
Others bonds — — —
Others — — —
Subtotal 4,464 16,226 11,762
(Securities whose carrying value does not exceed their acquisition cost)
Stock 1,834 1,049 (785)
Government
bonds — — —
Corporate
bonds — — —
Others bonds — — —
Others 4,902 4,846 (56)
Subtotal 6,736 5,895 (841)
Total ¥11,200 ¥22,121 ¥10,921
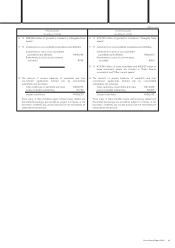
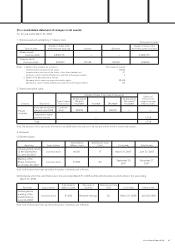
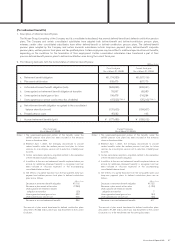
3. Other securities sold during the current fiscal year
(From April 1, 2007 to March 31, 2008)
Sales proceeds Total gain Total loss
4,823 801 (2)
4. Carrying value of major securities whose fair value is not
available is as follows: (As of March 31, 2008)
Other securities:
Unlisted domestic stocks (excluding those
traded on the over-the-counter market) ¥3,915
Unlisted foreign stocks 1,209
Unlisted foreign investment trusts 19,425
5. The redemption schedule for securities with maturity dates which
are classified as other securities and held-to-maturity debt securities
(As of March 31, 2008)
Due after Due after
one year five years
Types of Due within but within but within Due after
securities one year five years ten years ten years
Bonds:
Government
bonds ¥77 — — —
Corporate
bonds — 179 4 —
Total ¥77 ¥179 ¥4 —
Securities
1. Marketable other securities
(As of March 31, 2009)
Types of Acquisition Carrying Unrealized
securities cost value gain (loss)
(Securities whose carrying value exceed their acquisition cost)
Stock ¥1,319 ¥7,468 ¥6,149
Bonds:
Government
bonds 81 86 5
Corporate
bonds — — —
Others bonds — — —
Others — — —
Subtotal 1,400 7,554 6,154
(Securities whose carrying value does not exceed their acquisition cost)
Stock 3,226 1,560 (1,666)
Government
bonds — — —
Corporate
bonds 225 214 (11)
Others bonds 37 32 (5)
Others 221 130 (91)
Subtotal 3,709 1,936 (1,773)
Total ¥5,109 ¥9,490 ¥4,381
2. Other securities sold during the current fiscal year
(From April 1, 2008 to March 31, 2009)
Sales proceeds Total gain Total loss
557 381 (29)
3. Carrying value of major securities whose fair value is not
available is as follows: (As of March 31, 2009)
Other securities:
Unlisted domestic stocks (excluding those
traded on the over-the-counter market) ¥3,693
Unlisted foreign stocks 858
Unlisted foreign investment trusts 126,897
4. The redemption schedule for securities with maturity dates which
are classified as other securities and held-to-maturity debt securities
(As of March 31, 2009)
Due after Due after
one year five years
Types of Due within but within but within Due after
securities one year five years ten years ten years
Bonds:
Government
bonds 7 — 17 57
Corporate
bonds — 203 4 8
Other bonds
—21319
Total 7 205 34 84
(For securities)
Nissan Annual Report 2009 51