Nissan 2009 Annual Report Download - page 79
Download and view the complete annual report
Please find page 79 of the 2009 Nissan annual report below. You can navigate through the pages in the report by either clicking on the pages listed below, or by using the keyword search tool below to find specific information within the annual report.-
 1
1 -
2
-
3
-
4
-
5
-
6
-
7
-
8
-
9
-
10
-
11
-
12
-
13
-
14
-
15
-
16
-
17
-
18
-
19
-
20
-
21
-
22
-
23
-
24
-
25
-
26
-
27
-
28
-
29
-
30
-
31
-
32
-
33
-
34
-
35
-
36
-
37
-
38
-
39
-
40
-
41
-
42
-
43
-
44
-
45
-
46
-
47
-
48
-
49
-
50
-
51
-
52
-
53
-
54
-
55
-
56
-
57
-
58
-
59
-
60
-
61
-
62
-
63
-
64
-
65
-
66
-
67
-
68
-
 69
69 -
 70
70 -
 71
71 -
 72
72 -
 73
73 -
 74
74 -
 75
75 -
 76
76 -
 77
77 -
 78
78 -
 79
79 -
 80
80 -
 81
81 -
 82
82 -
 83
83 -
 84
84 -
 85
85 -
 86
86 -
 87
87
 |
 |

Nissan Annual Report 2009 77
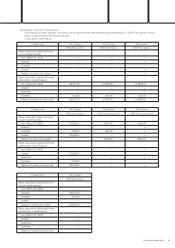
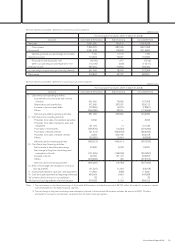
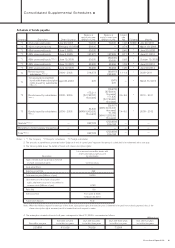
Prior fiscal year (From April 1, 2007 to March 31, 2008)
(Millions of yen)
North Other foreign
Japan America Europe countries Total Eliminations Consolidated
I. Sales and operating income:
Sales:
1. Sales to third parties 2,507,145 4,414,509 2,157,015 1,745,569 10,824,238 — 10,824,238
2. Inter-segment sales and
transfers 2,491,594 235,760 223,142 64,777 3,015,273 (3,015,273) —
Total 4,998,739 4,650,269 2,380,157 1,810,346 13,839,511 (3,015,273) 10,824,238
Operating expenses 4,722,036 4,332,404 2,259,486 1,729,236 13,043,162 (3,009,754) 10,033,408
Operating income 276,703 317,865 120,671 81,110 796,349 (5,519) 790,830
II. Total assets 6,171,415 5,345,010 1,553,029 1,201,330 14,270,784 (2,331,302) 11,939,482
Notes: 1. Countries and areas are segmented based on their geographical proximity and their mutual operational relationship.
2. Major countries and areas which belong to segments other than Japan are as follows:
(1) North America......................... The United States of America, Canada, and Mexico
(2) Europe........................................... France, The United Kingdom, Spain and other European countries
(3) Other............................................... Asia, Oceania, the Middle East, Central and South America excluding Mexico, and South Africa
3. Until the prior fiscal year, some of the Company’s consolidated subsidiaries charged directors’ retirement benefits to expense when so approved at the
annual general meetings of shareholders. As stated in “Changes in accounting policies,” however, they adopted the method of reporting an amount of
directors’ retirement benefits to be required at the year-end in accordance with the relevant internal regulations as accrued directors’ retirement benefits,
effective from the year ended March 31, 2008.
The effect of this change was to increase operating expenses by ¥441 million and to decrease operating income by ¥441 million for the Japan segment
compared with the results that would have been obtained under the former method.
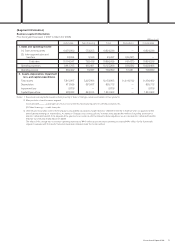
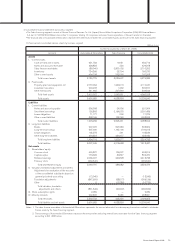
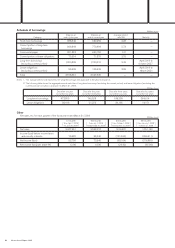
Geographical segment information
Current fiscal year (from April 1, 2008 to March 31, 2009)
(Millions of yen)
North Other foreign
Japan America Europe countries Total Eliminations Consolidated
I. Sales and operating income:
Sales:
1. Sales to third parties 2,327,800 2,980,313 1,429,654 1,699,207 8,436,974 — 8,436,974
2. Inter-segment sales and
transfers 1,871,884 176,601 111,100 84,044 2,243,629 (2,243,629) —
Total 4,199,684 3,156,914 1,540,754 1,783,251 10,680,603 (2,243,629) 8,436,974
Operating expenses 4,395,589 3,203,607 1,557,997 1,705,851 10,863,044 (2,288,149) 8,574,895
Operating income (loss) (195,905) (46,693) (17,243) 77,400 (182,441) 44,520 (137,921)
II. Total assets 5,534,204 4,606,446 963,649 1,108,645 12,212,944 (1,973,404) 10,239,540
Notes: 1. Countries and areas are segmented based on their geographical proximity and their mutual operational relationship.
2. Major countries and areas which belong to segments other than Japan are as follows:
(1) North America......................... The United States of America, Canada, and Mexico
(2) Europe........................................... France, The United Kingdom, Spain and other European countries
(3) Other............................................... Asia, Oceania, the Middle East, Central and South America excluding Mexico, and South Africa
3. Changes in accounting policies:
(1) Application of the “Practical Solution on Unification of Accounting Policies Applied to Foreign Subsidiaries for Consolidated Financial Statements”
Effective April 1, 2008, the Company adopted the “Practical Solution on Unification of Accounting Policies Applied to Foreign Subsidiaries for
Consolidated Financial Statements” (ASBJ Practical Issues Task Force (PITF) No. 18 issued on May 17, 2006).
As a result of this change, net sales decreased ¥136,262 million and ¥23,883 million for Europe and Other foreign countries, respectively. Operating
income decreased ¥548 million for Other foreign countries and increased ¥750 million for Eliminations. The operating loss decreased ¥371 million for
Europe and increased ¥3,222 million for North America.
(2) Classification to record sales incentive
As stated in “Changes in accounting policies,” the Company and its domestic consolidated subsidiaries applied the method of deducting sales incentive
from net sales, effective April 1, 2008.
The effect of this change was to decrease net sales by ¥15,938 million for the Japan segment compared with the result that would have been obtained
under the former method.