Nissan 2006 Annual Report Download - page 95
Download and view the complete annual report
Please find page 95 of the 2006 Nissan annual report below. You can navigate through the pages in the report by either clicking on the pages listed below, or by using the keyword search tool below to find specific information within the annual report.-
 1
1 -
2
-
3
-
4
-
5
-
6
-
7
-
8
-
9
-
10
-
11
-
12
-
13
-
14
-
15
-
16
-
17
-
18
-
19
-
20
-
21
-
22
-
23
-
24
-
25
-
26
-
27
-
28
-
29
-
30
-
31
-
32
-
33
-
34
-
35
-
36
-
37
-
38
-
39
-
40
-
41
-
42
-
43
-
44
-
45
-
46
-
47
-
48
-
49
-
50
-
51
-
52
-
53
-
54
-
55
-
56
-
57
-
58
-
59
-
60
-
61
-
62
-
63
-
64
-
65
-
66
-
67
-
68
-
69
-
70
-
71
-
72
-
73
-
74
-
75
-
76
-
77
-
78
-
79
-
80
-
81
-
82
-
83
-
84
-
 85
85 -
 86
86 -
 87
87 -
 88
88 -
 89
89 -
 90
90 -
 91
91 -
 92
92 -
 93
93 -
 94
94 -
 95
95 -
 96
96 -
 97
97 -
 98
98 -
 99
99 -
 100
100 -
 101
101 -
 102
102
 |
 |
Millions of
U.S. dollars (Note 1)
Millions of yen (except per
(except per share amounts and number of employees) share amounts)
2005 2004 2003 2002 2001 2005
For the years ended Mar. 31, 2006 Mar. 31, 2005 Mar. 31, 2004 Mar. 31, 2003 Mar. 31, 2002 Mar. 31, 2006
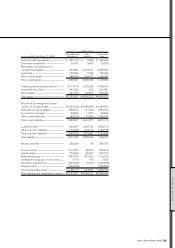
Net sales ¥3,895,553 ¥3,718,720 ¥3,480,290 ¥3,419,068 ¥3,019,860 $33,295
Operating income 254,159 231,764 245,836 316,059 242,279 2,172
Net income 240,593 102,415 80,713 72,869 183,449 2,056
Net income per share (Note 2) 54.88 23.24 18.15 16.09 45.61 0.47
Cash dividends paid (Note 3-4) 29.00 24.00 19.00 14.00 8.00 0.25
Shareholders’ equity ¥1,827,030 ¥1,685,893 ¥1,709,705 ¥1,798,716 ¥1,829,052 $15,616
Total assets 3,845,041 3,981,914 4,055,579 3,933,993 3,915,031 32,864
Long-term debt 508,463 489,151 653,392 902,118 942,518 4,346
Depreciation and amortization 127,543 115,180 102,107 56,760 56,265 1,090
Number of employees 32,180 32,177 31,389 31,128 30,365
Notes: 1. Unless indicated otherwise, all dollar figures herein refer to U.S. currency.Yen amounts have been translated into U.S. dollars, for convenience
only, at ¥117=$1, the approximate exchange rate on March 31, 2006.
2. Net income per share amounts are based on the weighted average number of shares of common stock outstanding during each year.
Figures for net income per share are in exact yen and U.S. dollars.
Number of shares outstanding as of March 31, 2006: 4,520,715,112.
3. Cash dividends paid represent the amounts proposed by the board of Directors as applicable to the respective years, together with the interim
cash dividends paid.
4. Cash dividends applicable to fiscal year 2005 is ¥29 per share.
NON-CONSOLIDATED FIVE-YEAR SUMMARY
Nissan Motor Co., Ltd. and Consolidated Subsidiaries
Fiscal years 2005, 2004, 2003, 2002 and 2001
Nissan Annual Report 2005 93
FINANCIAL SECTION