Nissan 2006 Annual Report Download - page 89
Download and view the complete annual report
Please find page 89 of the 2006 Nissan annual report below. You can navigate through the pages in the report by either clicking on the pages listed below, or by using the keyword search tool below to find specific information within the annual report.-
 1
1 -
2
-
3
-
4
-
5
-
6
-
7
-
8
-
9
-
10
-
11
-
12
-
13
-
14
-
15
-
16
-
17
-
18
-
19
-
20
-
21
-
22
-
23
-
24
-
25
-
26
-
27
-
28
-
29
-
30
-
31
-
32
-
33
-
34
-
35
-
36
-
37
-
38
-
39
-
40
-
41
-
42
-
43
-
44
-
45
-
46
-
47
-
48
-
49
-
50
-
51
-
52
-
53
-
54
-
55
-
56
-
57
-
58
-
59
-
60
-
61
-
62
-
63
-
64
-
65
-
66
-
67
-
68
-
69
-
70
-
71
-
72
-
73
-
74
-
75
-
76
-
77
-
78
-
 79
79 -
 80
80 -
 81
81 -
 82
82 -
 83
83 -
 84
84 -
 85
85 -
 86
86 -
 87
87 -
 88
88 -
 89
89 -
 90
90 -
 91
91 -
 92
92 -
 93
93 -
 94
94 -
 95
95 -
 96
96 -
 97
97 -
 98
98 -
 99
99 -
100
-
101
-
102
 |
 |

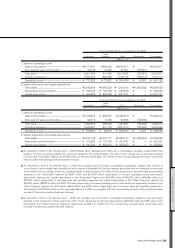
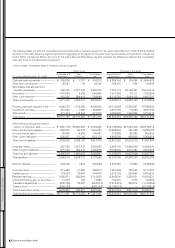
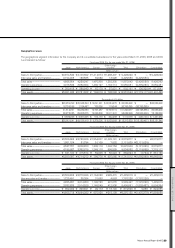
Millions of yen
Automobile and Sales Consolidated
Fiscal year 2004 (For the year ended Mar. 31, 2005) Eliminations Financing total
Operating activities
Income before income taxes and minority interests................................................................................................... ¥720,764 ¥ 72,469 ¥793,233
Depreciation and amortization...................................................................................................................................................... 349,163 176,763 525,926
(Increase) decrease in sales finance receivables......................................................................................................... 17,131 (811,480) (794,349)
Other.................................................................................................................................................................................................................. (207,813) 52,418 (155,395)
Net cash provided by (used in) operating activities .................................................................................................... 879,245 (509,830) 369,415
Investing activities
Proceeds from sales of investment securities including shares of subsidiaries................................. 10,285 510 10,795
Proceeds from sales of property, plant and equipment........................................................................................... 71,256 — 71,256
Purchases of fixed assets................................................................................................................................................................ (453,357) (7,789) (461,146)
Purchases of leased vehicles........................................................................................................................................................ (15,926) (574,679) (590,605)
Proceeds from sales of leased vehicles............................................................................................................................... 16,143 157,669 173,812
Other.................................................................................................................................................................................................................. (79,115) 9,968 (69,147)
Net cash used in investing activities........................................................................................................................................ (450,714) (414,321) (865,035)
Financing activities
Increase in short-term borrowings ............................................................................................................................................ 174,500 491,691 666,191
(Decrease) increase in long-term borrowings
and redemption of bonds and debentures ...................................................................................................................... (391,244) 296,551 (94,693)
Increase in bonds and debentures............................................................................................................................................ — 140,663 140,663
Other.................................................................................................................................................................................................................. (191,998) 883 (191,115)
Net cash provided by (used in) financing activities..................................................................................................... (408,742) 929,788 521,046
Effect of exchange rate changes on cash and cash equivalents............................................................................. 4,427 (58) 4,369
Increase in cash and cash equivalents........................................................................................................................................... 24,216 5,579 29,795
Cash and cash equivalents at beginning of year.................................................................................................................... 190,135 4,029 194,164
Increase due to inclusion in consolidation................................................................................................................................... 65,825 — 65,825
Cash and cash equivalents at end of year................................................................................................................................... ¥280,176 ¥ 9,608 ¥289,784
Nissan Annual Report 2005 87
FINANCIAL SECTION