Nissan 2006 Annual Report Download - page 31
Download and view the complete annual report
Please find page 31 of the 2006 Nissan annual report below. You can navigate through the pages in the report by either clicking on the pages listed below, or by using the keyword search tool below to find specific information within the annual report.-
 1
1 -
2
-
3
-
4
-
5
-
6
-
7
-
8
-
9
-
10
-
11
-
12
-
13
-
14
-
15
-
16
-
17
-
18
-
19
-
20
-
 21
21 -
 22
22 -
 23
23 -
 24
24 -
 25
25 -
 26
26 -
 27
27 -
 28
28 -
 29
29 -
 30
30 -
 31
31 -
 32
32 -
 33
33 -
 34
34 -
 35
35 -
 36
36 -
 37
37 -
 38
38 -
 39
39 -
 40
40 -
 41
41 -
42
-
43
-
44
-
45
-
46
-
47
-
48
-
49
-
50
-
51
-
52
-
53
-
54
-
55
-
56
-
57
-
58
-
59
-
60
-
61
-
62
-
63
-
64
-
65
-
66
-
67
-
68
-
69
-
70
-
71
-
72
-
73
-
74
-
75
-
76
-
77
-
78
-
79
-
80
-
81
-
82
-
83
-
84
-
85
-
86
-
87
-
88
-
89
-
90
-
91
-
92
-
93
-
94
-
95
-
96
-
97
-
98
-
99
-
100
-
101
-
102
 |
 |

Nissan Annual Report 2005 29
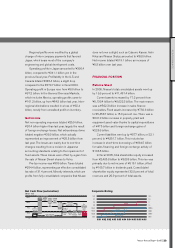
1,400
1,050
700
350
0
Free cash flow
¥271.3 billion
Financing
activities
¥154.2 billion
Net
automotive
cash at
the end
of FY04
Net
automotive
cash at the
end of
FY05
Operating
activities
Working
capital
and
others Investing
activities
Dividend
paid
Other
financial
activities
FX rate
impact
+1,106.3
+76.8
Pension
fund
–222.2
–419.8
Tax
paid
–269.8
+4.2
–105.7 –52.7 +50.0
372.9
205.8
Treasury
stock
Net Cash Flow (automotive)
(Billion Yen)
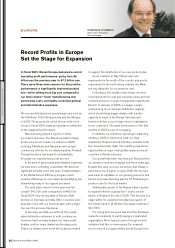
Regional profits were modified by a global
change of inter-company payments that favored
Japan, which bears most of the company’s
engineering and global development costs.
Operating profits in Japan amounted to ¥390.4
billion, compared to ¥341.1 billion yen in the
previous fiscal year. Profitability in the U.S. and
Canada totaled ¥345.4 billion, a slight drop
compared to the ¥379.7 billion in fiscal 2004.
Operating profit in Europe rose from ¥56 billion to
¥67.2 billion. In the General Overseas Markets,
which includes Mexico, operating profits came to
¥101.2 billion, up from ¥84.8 billion last year. Inter-
regional eliminations resulted in a loss of ¥32.4
billion, mostly from unrealized profit on inventory.
Net Income
Net non-operating expenses totaled ¥25.9 billion,
¥20.4 billion higher than last year, largely the result
of foreign exchange losses. Net extraordinary items
totaled negative ¥36.9 billion, which actually
represented an improvement of ¥25.5 billion from
last year. The losses are mainly due to one-time
changes resulting from a revision in Japanese
accounting standards relating to the impairment of
fixed assets. These losses were offset by a gain from
the sale of Nissan Diesel shares to Volvo.
Pre-tax income was ¥809 billion. Taxes totaled
¥254.4 billion, representing an effective consolidated
tax rate of 31.4 percent. Minority interests, which are
profits from fully consolidated companies that Nissan
does not own outright, such as Calsonic Kansei, Aichi
Kikai and Nissan Shatai, amounted to ¥36.5 billion.
Net income totaled ¥518.1 billion, an increase of
¥5.8 billion over last year.
FINANCIAL POSITION
Balance Sheet
In 2005, Nissan’s total consolidated assets went up
by 16.6 percent to ¥11,481.4 billion.
Current assets increased by 17.2 percent from
¥5,139.4 billion to ¥6,022.3 billion. The main reason
was a ¥562.3 billion increase in sales finance
receivables. Fixed assets increased by ¥750.6 billion
to ¥5,458.7 billion, a 15.9 percent rise. There was a
¥641.9 billion increase in property, plant and
equipment asset value thanks to capital expenditures
of ¥475 billion and foreign exchange gains of
¥228.6 billion.
Current liabilities went up by ¥877 billion, or 22.1
percent, to ¥4,851.7 billion. This included an
increase in short-term borrowings of ¥664.5 billion
for sales financing and foreign exchange activity of
¥198.5 billion.
In fiscal 2005, total shareholder equity increased
from ¥2,465.8 billion to ¥3,088 billion. This rise was
primarily due to net income of ¥518.1 billion, offset
by ¥105.7 billion in dividends paid. Consolidated
shareholder equity represented 32.8 percent of total
revenues and 26.9 percent of total assets.
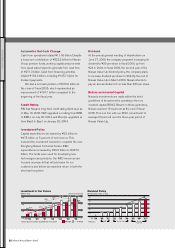
Moody’s
S&P
R&I
A+
AA–
A
A–
BBB+
BBB
BBB–
BB+
Aa3
A1
A2
A3
Baa1
Baa2
Baa3
Ba1
9/01 4/02 9/02 4/03 9/03 4/04 9/04 4/05 9/05 4/06
Corporate Rating
PERFORMANCE