Nissan 2006 Annual Report Download - page 82
Download and view the complete annual report
Please find page 82 of the 2006 Nissan annual report below. You can navigate through the pages in the report by either clicking on the pages listed below, or by using the keyword search tool below to find specific information within the annual report.-
 1
1 -
2
-
3
-
4
-
5
-
6
-
7
-
8
-
9
-
10
-
11
-
12
-
13
-
14
-
15
-
16
-
17
-
18
-
19
-
20
-
21
-
22
-
23
-
24
-
25
-
26
-
27
-
28
-
29
-
30
-
31
-
32
-
33
-
34
-
35
-
36
-
37
-
38
-
39
-
40
-
41
-
42
-
43
-
44
-
45
-
46
-
47
-
48
-
49
-
50
-
51
-
52
-
53
-
54
-
55
-
56
-
57
-
58
-
59
-
60
-
61
-
62
-
63
-
64
-
65
-
66
-
67
-
68
-
69
-
70
-
71
-
 72
72 -
 73
73 -
 74
74 -
 75
75 -
 76
76 -
 77
77 -
 78
78 -
 79
79 -
 80
80 -
 81
81 -
 82
82 -
 83
83 -
 84
84 -
 85
85 -
 86
86 -
 87
87 -
 88
88 -
 89
89 -
 90
90 -
 91
91 -
 92
92 -
93
-
94
-
95
-
96
-
97
-
98
-
99
-
100
-
101
-
102
 |
 |

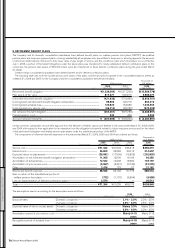
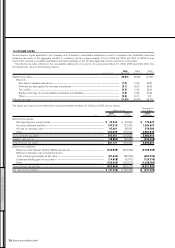
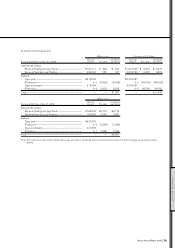
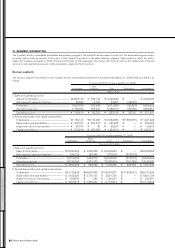
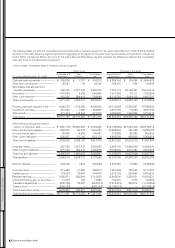
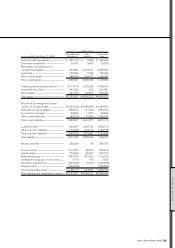
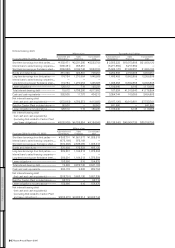
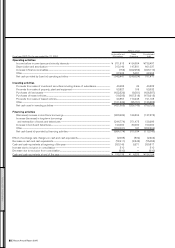
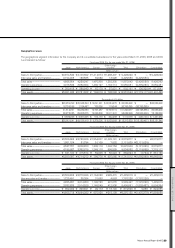
Business segments
The business segment information for the Company and its consolidated subsidiaries for the years ended March 31, 2006, 2005 and 2004 is as
follows:
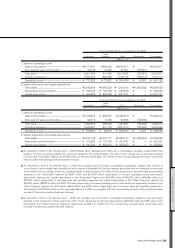
Fiscal year 2005 (For the year ended Mar. 31, 2006)
Sales
Automobile Financing Total Eliminations Consolidated
Millions of yen
I. Sales and operating income
Sales to third parties........................................................................... ¥8,895,143 ¥ 533,149 ¥ 9,428,292 ¥ — ¥ 9,428,292
Inter-segment sales and transfers........................................... 28,563 14,794 43,357 (43,357) —
Total sales.................................................................................................... 8,923,706 547,943 9,471,649 (43,357) 9,428,292
Operating expenses............................................................................ 8,160,292 478,218 8,638,510 (82,059) 8,556,451
Operating income.................................................................................. ¥ 763,414 ¥ 69,725 ¥ 833,139 ¥ 38,702 ¥ 871,841
II. Assets, depreciation and capital expenditures
Total assets ................................................................................................ ¥7,152,144 ¥5,710,239 ¥12,862,383 ¥(1,380,957) ¥11,481,426
Depreciation and amortization.................................................... ¥ 400,787 ¥ 254,615 ¥ 655,402 ¥ — ¥ 655,402
Impairment loss on fixed assets................................................ ¥ 26,794 ¥ 33 ¥ 26,827 ¥ — ¥ 26,827
Capital expenditures........................................................................... ¥ 503,916 ¥ 920,398 ¥ 1,424,314 ¥ — ¥ 1,424,314
Fiscal year 2005 (For the year ended Mar. 31, 2006)
Sales
Automobile Financing Total Eliminations Consolidated
Thousands of U.S. dollars
I. Sales and operating income
Sales to third parties............................................................. $76,026,863 $ 4,556,829 $ 80,583,692 $ — $80,583,692
Inter-segment sales and transfers............................. 244,129 126,444 370,573 (370,573) —
Total sales...................................................................................... 76,270,992 4,683,273 80,954,265 (370,573) 80,583,692
Operating expenses.............................................................. 69,746,086 4,087,333 73,833,419 (701,359) 73,132,060
Operating income.................................................................... $ 6,524,906 $ 595,940 $ 7,120,846 $ 330,786 $ 7,451,632
II. Assets, depreciation and capital expenditures
Total assets .................................................................................. $61,129,435 $48,805,462 $109,934,897 $(11,803,051) $98,131,846
Depreciation and amortization...................................... $ 3,425,529 $ 2,176,197 $ 5,601,726 $ — $ 5,601,726
Impairment loss on fixed assets.................................. $ 229,009 $ 282 $ 229,291 $ — $ 229,291
Capital expenditures............................................................. $ 4,306,975 $ 7,866,649 $ 12,173,624 $ — $12,173,624
Nissan Annual Report 2005
80
FINANCIAL SECTION
21. SEGMENT INFORMATION
The Company and its consolidated subsidiaries are primarily engaged in the manufacture and sales of products in the automobile segment and in
providing various financial services to the users of the Company’s products in the sales financing segment. These products, which are sold in
Japan and overseas, principally in North America and Europe, include passenger cars, buses and trucks as well as the related parts. Financial
services include primarily leases and credits principally in Japan and North America.